

Question: For the given data, the x = inches (rosod your response to four decimat pleces) Based on the sampling done, the oontroi imts for 3-sigma
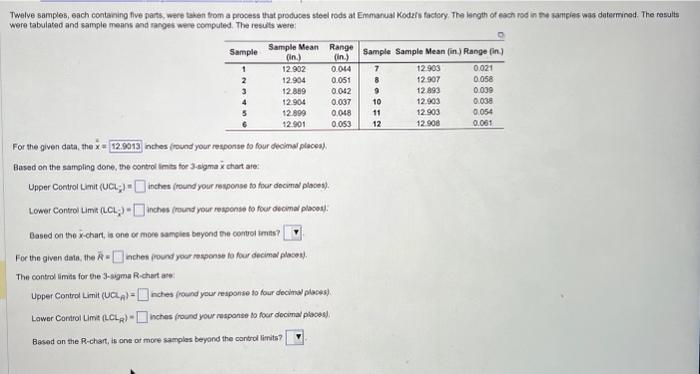
For the given data, the x = inches (rosod your response to four decimat pleces) Based on the sampling done, the oontroi imts for 3-sigma x chart are: Upper Control Limit (UCL-) = inches (round your response to foar docinal places). Lower Controi Limi (LCli)= inches (round your response to four decinal plases.. Based on the x-chart, is one or more samcits beyond the contod imes? For the given data. the R= inches iround your response fo four decimal ploses). The control limits for the 3-sigma R-chart ace. Upper Control Limit (UULn)= inctes (round your responis to four decimial placess) Lawer Control Limit (LCLR) = Wiches frocnd your masponse to four docknal placest. Baspd on the R-chist, is one or more samplas beyond the control limits
Step by Step Solution
There are 3 Steps involved in it

Get step-by-step solutions from verified subject matter experts