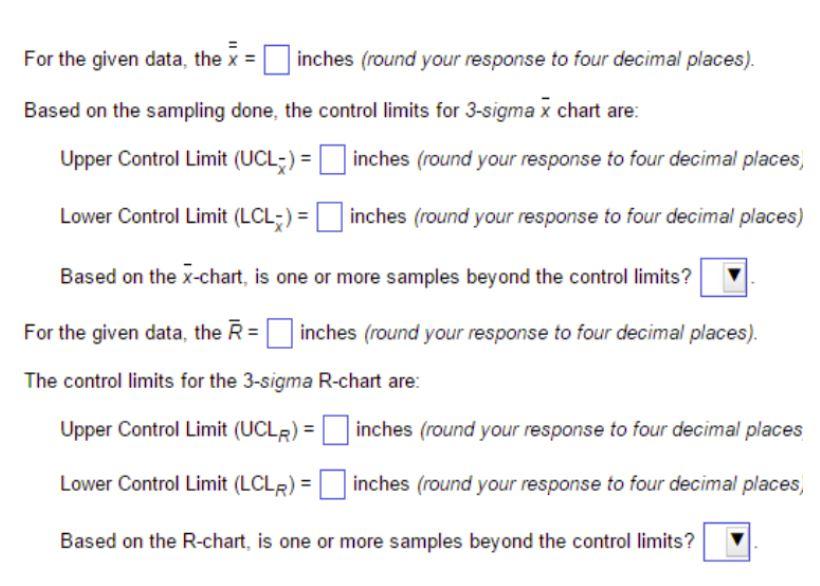
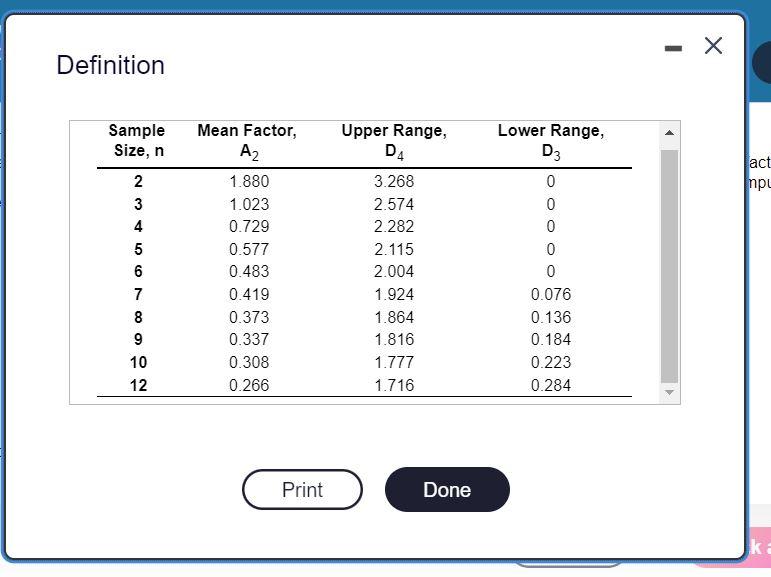
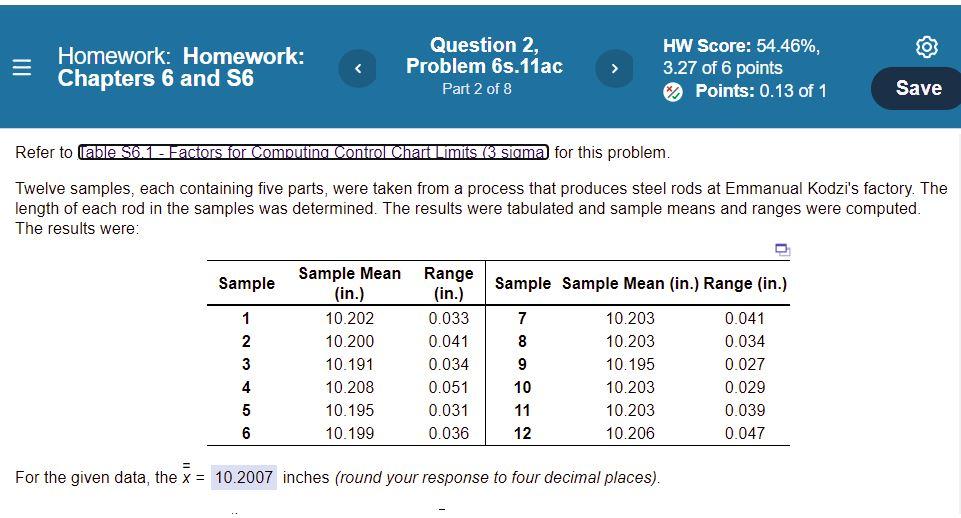
Question: For the given data, the x = inches (round your response to four decimal places). Based on the sampling done, the control limits for 3-sigma

For the given data, the x = inches (round yourFor the given data, the x = inches (round yourFor the given data, the x = inches (round your

For the given data, the x = inches (round your response to four decimal places). Based on the sampling done, the control limits for 3-sigma x chart are: Upper Control Limit (UCL-) = [ inches (round your response to four decimal places, inches (round your response to four decimal places) Lower Control Limit (LCL-) = Based on the x-chart, is one or more samples beyond the control limits? For the given data, the R = The control limits for the 3-sigma R-chart are: Upper Control Limit (UCL) = [ inches (round your response to four decimal places). inches (round your response to four decimal places inches (round your response to four decimal places, Lower Control Limit (LCLR) = [ Based on the R-chart, is one or more samples beyond the control limits? Definition Sample Size, n 23 4 5 6 7 8 9 10 12 Mean Factor, A 1.880 1.023 0.729 0.577 0.483 0.419 0.373 0.337 0.308 0.266 Print Upper Range, D4 3.268 2.574 2.282 2.115 2.004 1.924 1.864 1.816 1.777 1.716 Done Lower Range, D3 0 0 0 0 0 0.076 0.136 0.184 0.223 0.284 - X act mpu ka = Homework: Homework: Chapters 6 and S6 Sample 1 2 3 4 5 Question 2, Problem 6s.11ac Part 2 of 8 6 Refer to Table $6.1 - Factors for Computing Control Chart Limits (3 sigma) for this problem. Twelve samples, each containing five parts, were taken from a process that produces steel rods at Emmanual Kodzi's factory. The length of each rod in the samples was determined. The results were tabulated and sample means and ranges were computed. The results were: Sample Mean Range (in.) (in.) 10.202 0.033 10.200 0.041 10.191 0.034 10.208 0.051 10.195 0.031 10.199 0.036 > 9 10 11 12 Sample Sample Mean (in.) Range (in.) 7 8 HW Score: 54.46%, 3.27 of 6 points Points: 0.13 of 1 10.203 10.203 10.195 10.203 10.203 10.206 For the given data, the x = 10.2007 inches (round your response to four decimal places). Save 0.041 0.034 0.027 0.029 0.039 0.047

Step by Step Solution

There are 3 Steps involved in it

1 Expert Approved Answer
Step: 1 Unlock blur-text-image
Question Has Been Solved by an Expert!

Get step-by-step solutions from verified subject matter experts

Step: 2 Unlock
Step: 3 Unlock

Students Have Also Explored These Related General Management Questions!