

Question: For the given data, the x= inches (round your response to four decimal places). Based on the sampling done, the control limits for 3 -sigma
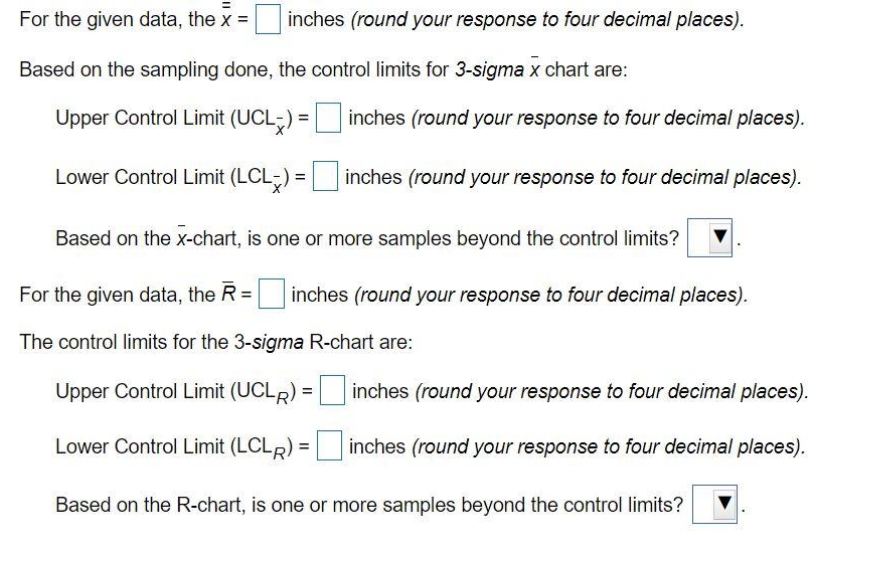
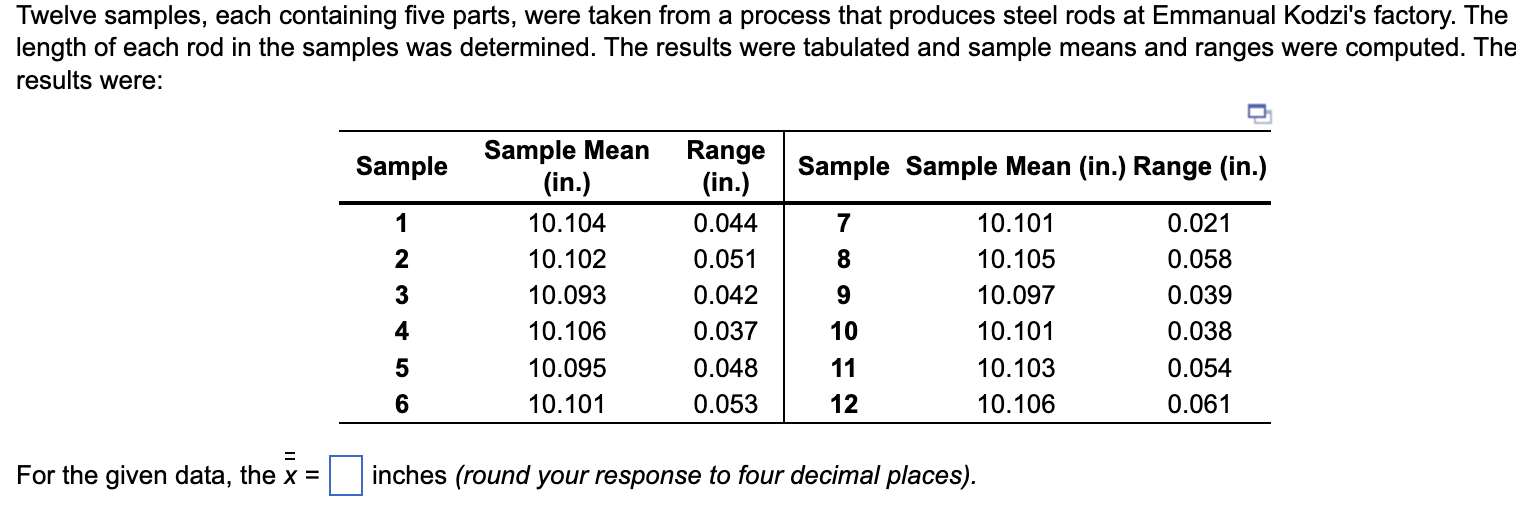
For the given data, the x= inches (round your response to four decimal places). Based on the sampling done, the control limits for 3 -sigma x chart are: Upper Control Limit (UCL)= inches (round your response to four decimal places). Lower Control Limit (LCL)=inches (round your response to four decimal places). Based on the x-chart, is one or more samples beyond the control limits? For the given data, the R= inches (round your response to four decimal places). The control limits for the 3-sigma R-chart are: Upper Control Limit (UCLR)= inches (round your response to four decimal places). Lower Control Limit (LCLR)= inches (round your response to four decimal places). Based on the R-chart, is one or more samples beyond the control limits? Twelve samples, each containing five parts, were taken from a process that produces steel rods at Emmanual Kodzi's factory. T length of each rod in the samples was determined. The results were tabulated and sample means and ranges were computed. results were: For the given data, the x= inches (round your response to four decimal places)
Step by Step Solution
There are 3 Steps involved in it

Get step-by-step solutions from verified subject matter experts