

Question: For the given data, the x=8.9013 inches (round your response to four decimal places). Based on the sampling done, the control limits for 3-sigma x
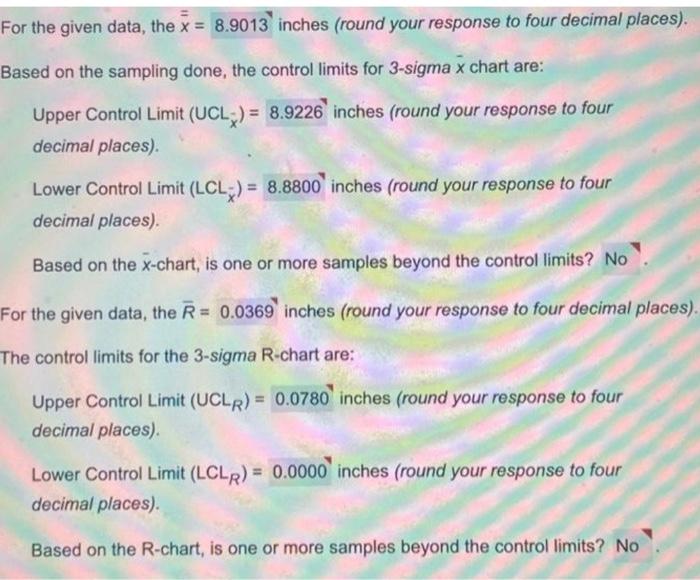
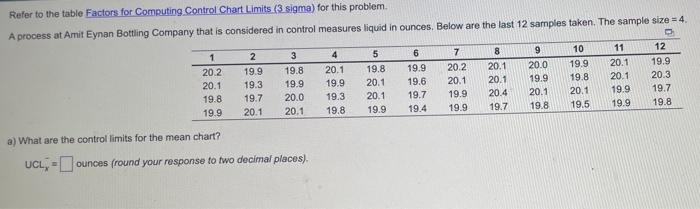
For the given data, the x=8.9013 inches (round your response to four decimal places). Based on the sampling done, the control limits for 3-sigma x chart are: Upper Control Limit (UCL^)= inches (round your response to four decimal places). Lower Control Limit (LCL~)=8.8800 inches (round your response to four decimal places). Based on the x-chart, is one or more samples beyond the control limits? No . For the given data, the R=0.0369 inches (round your response to four decimal places). The control limits for the 3 -sigma R-chart are: Upper Control Limit (UCLR)=0.0780 inches ( round your response to four decimal places). Lower Control Limit (LCLR)=0.0000 inches (round your response to four decimal places). Based on the R-chart, is one or more samples beyond the control limits? No . Refer to the table Factors for Computing Control Chart Limits (3 sigma) for this problem. A process at Amit Eynan Bottling Company that is considered in control measures liquid in ounces, Below are the last 12 samples taken. The sample size = 4. 3) What are the control limits for the mean chart? UCLxounces (round your response to two decimal places)
Step by Step Solution
There are 3 Steps involved in it

Get step-by-step solutions from verified subject matter experts