

Question: for the given data, x bar = 10.9008 Based on the sampling done, the control limits for 3-sigma chart are Upper Control Limit (UCL;) -
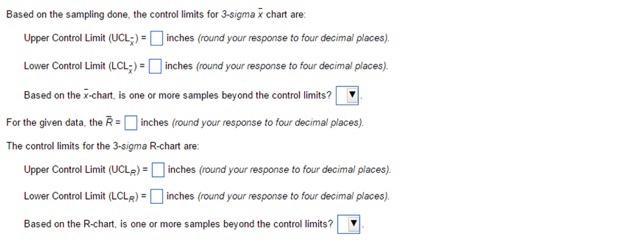
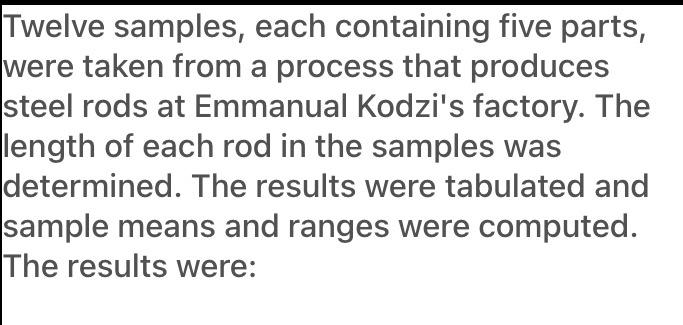
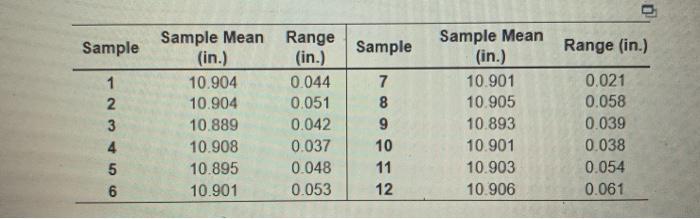
for the given data, x bar = 10.9008
Step by Step Solution
There are 3 Steps involved in it
1 Expert Approved Answer
Step: 1 Unlock

Question Has Been Solved by an Expert!
Get step-by-step solutions from verified subject matter experts
Step: 2 Unlock
Step: 3 Unlock