

Question: Refer to Table S6.1 - Factors for Computing Control Chart Limits (3 sigma) LOADING... for this problem. Sampling 4 pieces of precision-cut wire (to be
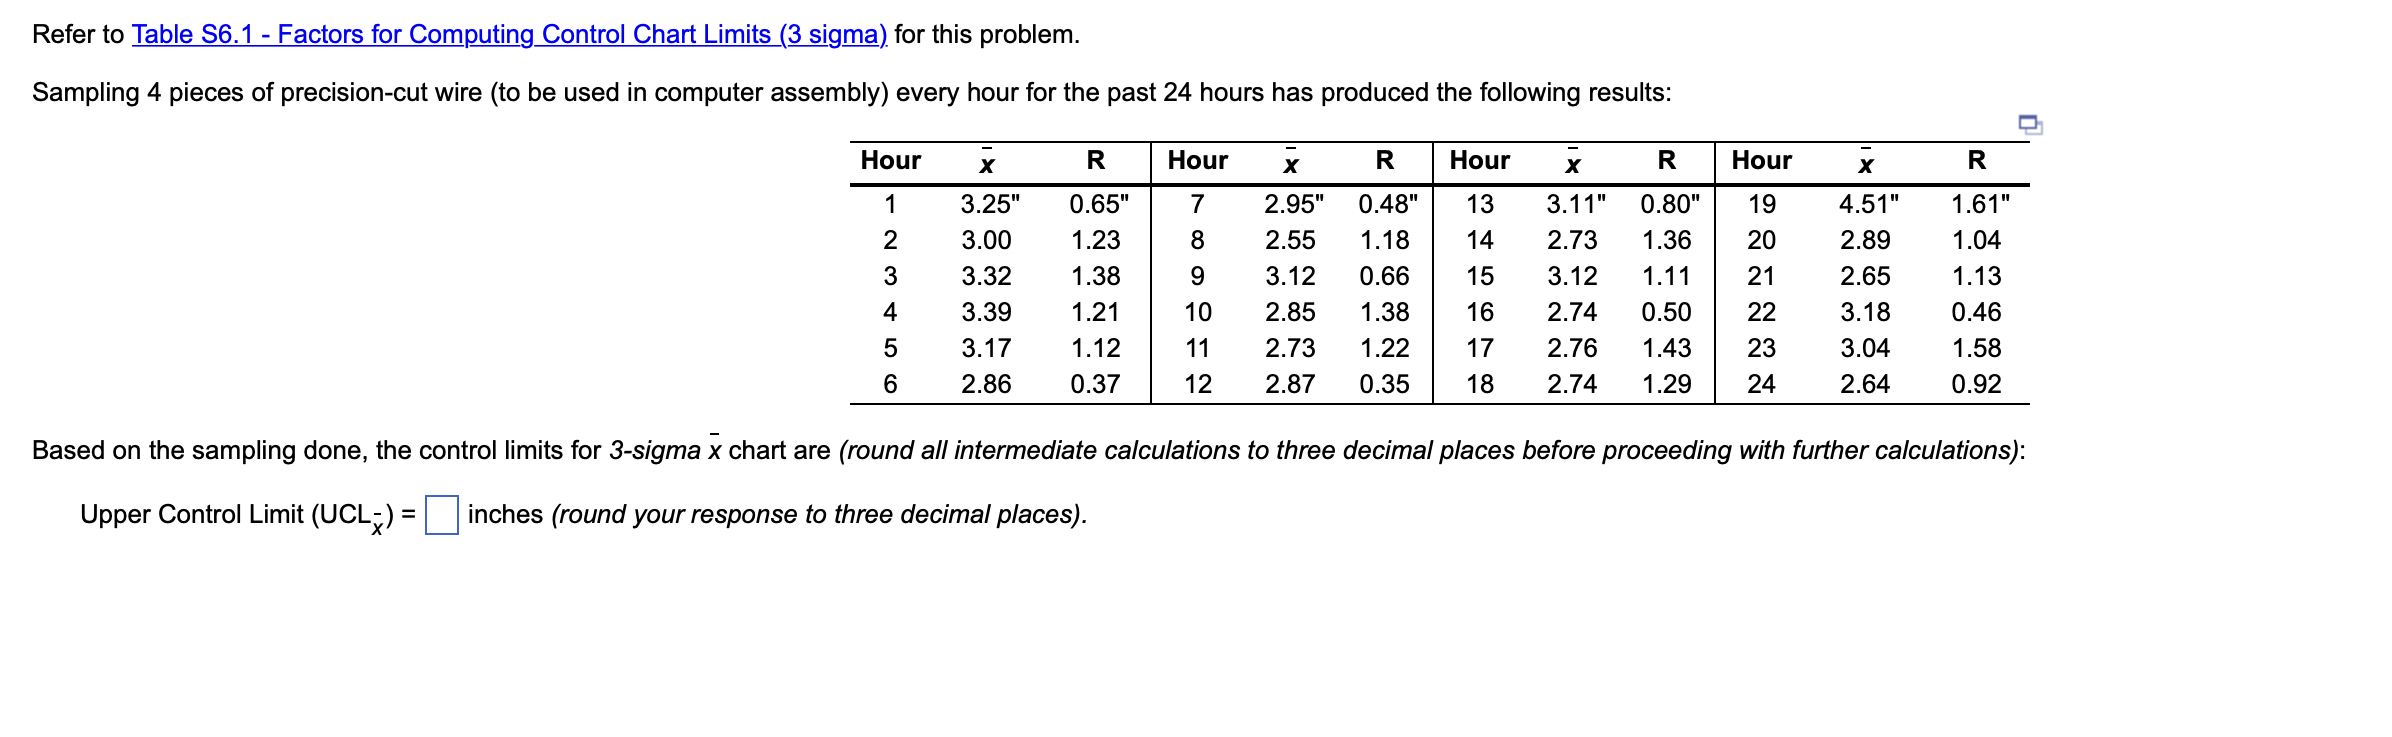


Refer to Table S6.1 - Factors for Computing Control Chart Limits (3 sigma) LOADING... for this problem. Sampling 4 pieces of precision-cut wire (to be used in computer assembly) every hour for the past 24 hours has produced the following results: Hour x R Hour x R Hour x R Hour x R 1 3.25" 0.65" 7 2.95" 0.48" 13 3.11" 0.80" 19 4.51" 1.61" 2 3.00 1.23 8 2.55 1.18 14 2.73 1.36 20 2.89 1.04 3 3.32 1.38 9 3.12 0.66 15 3.12 1.11 21 2.65 1.13 4 3.39 1.21 10 2.85 1.38 16 2.74 0.50 22 3.18 0.46 5 3.17 1.12 11 2.73 1.22 17 2.76 1.43 23 3.04 1.58 6 2.86 0.37 12 2.87 0.35 18 2.74 1.29 24 2.64 0.92 Based on the sampling done, the control limits for 3-sigma x chart are (round all intermediate calculations to three decimal places before proceeding with further calculations): Part 2 Upper Control Limit (UCLx) = enter your response here inches (round your response to three decimal places).
Lower Control Limit (LCLx)= enter your response here ... inches (round your response to three decimal places).
The control limits for the 3-sigma R-chart are:
Upper Control Limit (UCLR) = enter your response here ... inches (round your response to three decimal places).
Lower Control Limit (LCLR) = enter your response here... inches (round your response to three decimal places).
Refer to Table S6.1 - Factors for Computing Control Chart Limits (3 sigma) for this problem. Sampling 4 pieces of precision-cut wire (to be used in computer assembly) every hour for the past 24 hours has produced the following results: Hour 1 2 3 4 5 6 X R 3.25" 0.65" 3.00 1.23 3.32 1.38 3.39 1.21 3.17 1.12 2.86 0.37 Hour X R Hour X R Hour 7 2.95" 0.48" 13 3.11" 0.80" 19 8 2.55 1.18 14 2.73 1.36 20 9 3.12 0.66 15 3.12 1.11 21 10 2.85 1.38 16 2.74 0.50 22 11 2.73 1.22 17 2.76 1.43 23 12 2.87 0.35 18 2.74 1.29 24 X 4.51" 2.89 2.65 3.18 3.04 2.64 R 1.61" 1.04 1.13 0.46 1.58 0.92 Based on the sampling done, the control limits for 3-sigma x chart are (round all intermediate calculations to three decimal places before proceeding with further calculations): Upper Control Limit (UCL) = inches (round your response to three decimal places). Lower Control Limit (LCL-) = inches (round your response to three decimal places). The control limits for the 3-sigma R-chart are: Upper Control Limit (UCLR) = inches (round your response to three decimal places). Lower Control Limit (LCLR) = inches (round your response to three decimal places)Step by Step Solution
There are 3 Steps involved in it

Get step-by-step solutions from verified subject matter experts