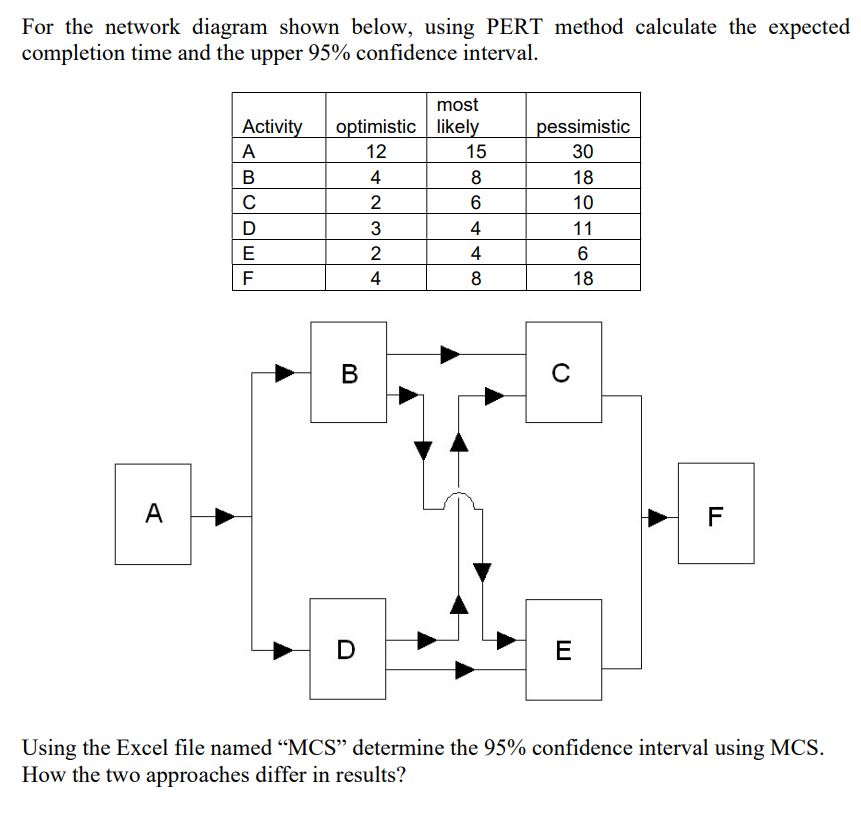
Question: For the network diagram shown below, using PERT method calculate the expected completion time and the upper 95% confidence interval. Activity most optimistic likely 12

For the network diagram shown below, using PERT

For the network diagram shown below, using PERT method calculate the expected completion time and the upper 95% confidence interval. Activity most optimistic likely 12 4 8 2 6 15 pessimistic 30 18 10 B 000 + + CD no Using the Excel file named MCS determine the 95% confidence interval using MCS. How the two approaches differ in results

Step by Step Solution

There are 3 Steps involved in it

1 Expert Approved Answer
Step: 1 Unlock blur-text-image
Question Has Been Solved by an Expert!

Get step-by-step solutions from verified subject matter experts

Step: 2 Unlock
Step: 3 Unlock

Students Have Also Explored These Related General Management Questions!