

Question: For the plot shown here, what would the appropriate trend line be? A) Linear B) Logarithmic C) Quadratic D) Exponential Netflix Revenue in million U.S.
For the plot shown here, what would the appropriate trend line be?
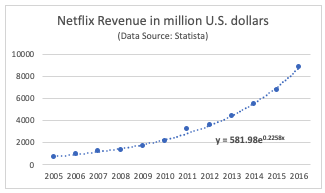
A) Linear
B) Logarithmic
C) Quadratic
D) Exponential
Netflix Revenue in million U.S. dollars (Data Source: Statista) 10000 8000 6000 4000 2000 y581.98e0225 2005 2006 2007 2008 2009 2010 2011 2012 2013 2014 2015 2016Step by Step Solution
There are 3 Steps involved in it
1 Expert Approved Answer
Step: 1 Unlock

Question Has Been Solved by an Expert!
Get step-by-step solutions from verified subject matter experts
Step: 2 Unlock
Step: 3 Unlock