

Question: For the plot shown here, what would the appropriate trend line be? A) Logarithmic B) Linear C) Quadratic D) Exponential Microsoft Revenue in billion U.S.
For the plot shown here, what would the appropriate trend line be?
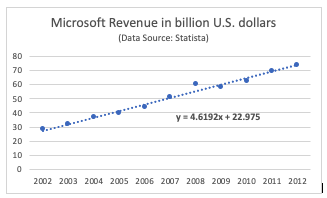
A) Logarithmic
B) Linear
C) Quadratic
D) Exponential
Microsoft Revenue in billion U.S. dollars (Data Source: Statista) 80 70 60 50 40 30 20 10 0 y = 4.6192x + 22.975 2002 2003 2004 2005 2006 2007 2008 2009 2010 2011 2012
Step by Step Solution
There are 3 Steps involved in it
1 Expert Approved Answer
Step: 1 Unlock

Question Has Been Solved by an Expert!
Get step-by-step solutions from verified subject matter experts
Step: 2 Unlock
Step: 3 Unlock