

Question: For the points below find the regression line using least square fit. Please draw the full table as shown in the slide during class. X

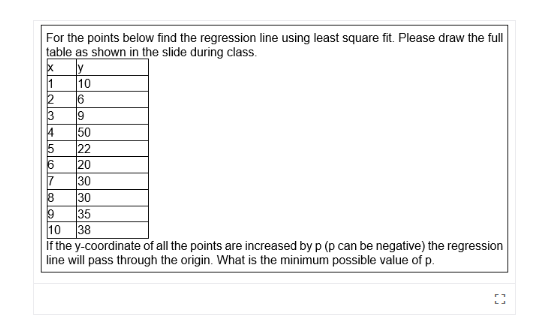
For the points below find the regression line using least square fit. Please draw the full table as shown in the slide during class. X 10 CO 50 5 122 6 20 30 30 9 35 10 38 If the y-coordinate of all the points are increased by p (p can be negative) the regression line will pass through the origin. What is the minimum possible value of p
Step by Step Solution
There are 3 Steps involved in it
1 Expert Approved Answer
Step: 1 Unlock

Question Has Been Solved by an Expert!
Get step-by-step solutions from verified subject matter experts
Step: 2 Unlock
Step: 3 Unlock