

Question: For the previous table create an R chart for the processing time (in minutes) of the laboratory technicians. Comment on whether the process is in
For the previous table create an R chart for the processing time (in minutes) of the laboratory technicians. Comment on whether the process is in control regarding the R chart, and discuss why x-bar and R charts must be used in conjunction with each other.
Please show how the chart and provide explanation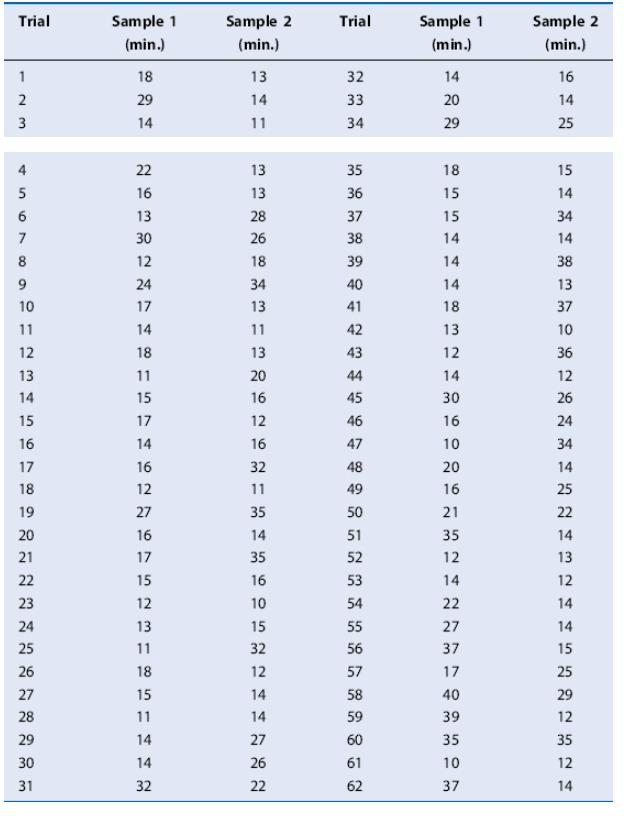
Trial Sample 1 Sample 2 Trial Sample 1 Sample 2 (min.) (min.) (min.) (min.) 18 13 32 14 16 2 29 14 33 20 14 3 14 11 34 29 25 22 13 35 18 15 16 13 36 15 14 13 28 37 15 34 7 30 26 38 14 14 8 12 18 39 14 38 24 34 40 14 13 10 17 13 41 18 37 11 14 11 42 13 10 12 18 13 43 12 36 13 11 20 44 14 12 14 15 16 45 30 26 15 17 12 46 16 24 16 14 16 47 10 34 17 16 32 48 20 14 18 12 11 49 16 25 19 27 35 50 21 22 20 16 14 51 35 14 21 17 35 52 12 13 22 15 16 53 14 12 23 12 10 54 22 14 24 13 15 55 27 14 25 11 32 56 37 15 26 18 12 57 17 25 27 15 14 58 40 29 28 11 14 59 39 12 29 14 27 60 35 35 30 14 26 61 10 12 31 32 22 62 37 14 4S6N
Step by Step Solution
3.46 Rating (169 Votes )
There are 3 Steps involved in it

Get step-by-step solutions from verified subject matter experts