

Question: For the profit model developed in Example and the Excel model in Figure, suppose that the demand is triangular with a minimum of 35,000, maximum
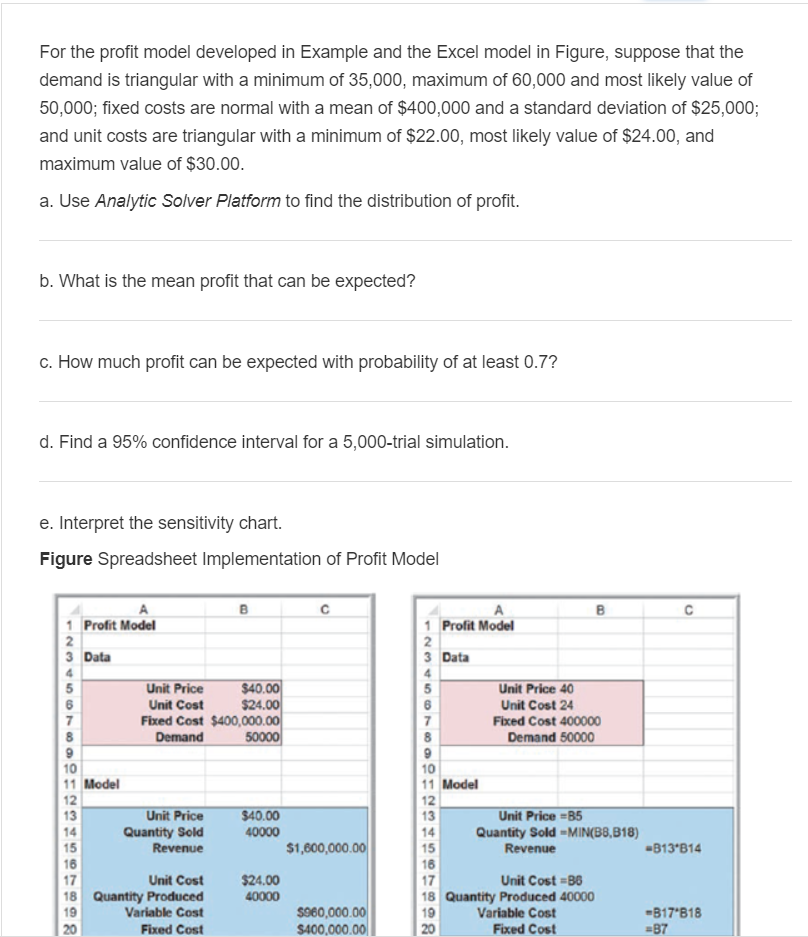
For the profit model developed in Example and the Excel model in Figure, suppose that the demand is triangular with a minimum of 35,000, maximum of 60,000 and most likely value of 50,000; fixed costs are normal with a mean of $400,000 and a standard deviation of $25,000; and unit costs are triangular with a minimum of $22.00, most likely value of $24.00, and maximum value of $30.00 a. Use Analytic Solver Platform to find the distribution of profit b. What is the mean profit that can be expected? c. How much profit can be expected with probability of at least 0.7? d. Find a 95% confidence interval for a 5,000-trial simulation e. Interpret the sensitivity chart. Figure Spreadsheet Implementation of Profit Model Profit Model 3 Data 5 1 Profit Model 3 Data Unit Price Unit Cost Unit Price 40 Unit Cost 24 $24. Fixed Cost $400,000 Fixed Cost 400000 Demand 50000 11 Mode 12 11 Model Unit Price Quantity Sold 40.00 40000 13 14 Quantity Sold MIN(B8,818) 15 16 Unit Price-85 14 15 16 1,600,000.00 #813.814 Unit Cost 8 Unit Cost $24.00 18 Quantity Produced 19 8 Quantity Produced 40000 Variable Cost Fixed Cost $960,000.00 400,000.00 B17 818 Variable Cost Fixed Cost For the profit model developed in Example and the Excel model in Figure, suppose that the demand is triangular with a minimum of 35,000, maximum of 60,000 and most likely value of 50,000; fixed costs are normal with a mean of $400,000 and a standard deviation of $25,000; and unit costs are triangular with a minimum of $22.00, most likely value of $24.00, and maximum value of $30.00 a. Use Analytic Solver Platform to find the distribution of profit b. What is the mean profit that can be expected? c. How much profit can be expected with probability of at least 0.7? d. Find a 95% confidence interval for a 5,000-trial simulation e. Interpret the sensitivity chart. Figure Spreadsheet Implementation of Profit Model Profit Model 3 Data 5 1 Profit Model 3 Data Unit Price Unit Cost Unit Price 40 Unit Cost 24 $24. Fixed Cost $400,000 Fixed Cost 400000 Demand 50000 11 Mode 12 11 Model Unit Price Quantity Sold 40.00 40000 13 14 Quantity Sold MIN(B8,818) 15 16 Unit Price-85 14 15 16 1,600,000.00 #813.814 Unit Cost 8 Unit Cost $24.00 18 Quantity Produced 19 8 Quantity Produced 40000 Variable Cost Fixed Cost $960,000.00 400,000.00 B17 818 Variable Cost Fixed Cost
Step by Step Solution
There are 3 Steps involved in it

Get step-by-step solutions from verified subject matter experts