

Question: For the ProValue fund, on a single graph, plot the following: portfolio expected returns vs. standard deviations based on optimized weights of holdings. the risk
- For the ProValue fund, on a single graph, plot the following:
- portfolio expected returns vs. standard deviations based on optimized weights of holdings.
- the risk vs. expected return for ProValue portfolio, assuming the nine original and two proposed new (ATO and CNO) stocks have equal weights (1/11 each).
- Comment on what the graph shows.
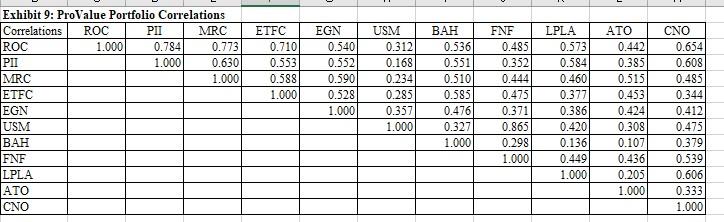
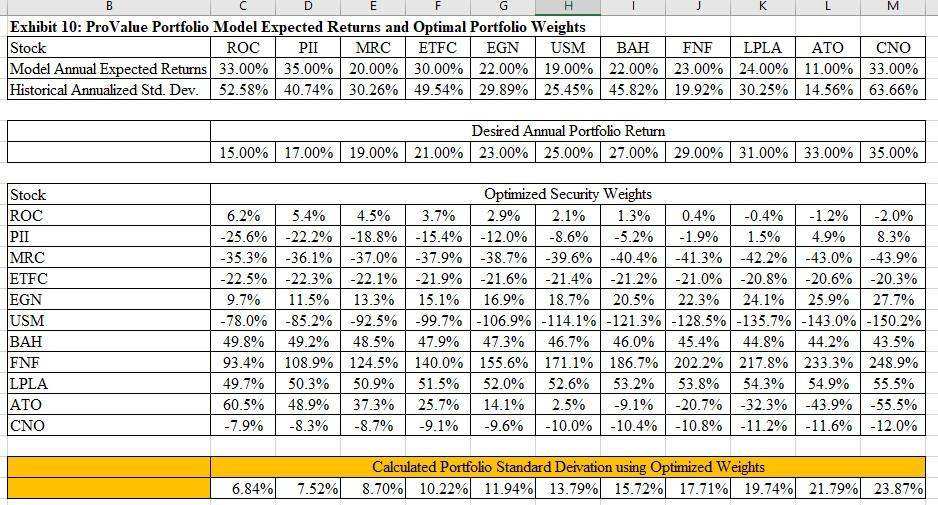
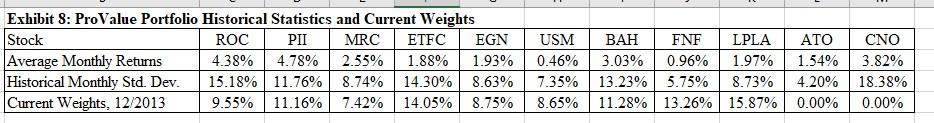
ETFC 0.710 0.553 0.588 1.000 Exhibit 9: ProValue Portfolio Correlations Correlations ROC PII MRC ROC 1.000 0.784 0.773 PII 1.000 0.630 MRC 1.000 ETFC EGN USM BAH FNF LPLA ATO CNO EGN 0.540 0.552 0.590 0.528 1.000 USM 0.312 0.168 0.234 0.285 0.357 1.000 BAH 0.536 0.551 0.510 0.585 0.476) 0.327 1.000 FNF 0.485 0.352 0.444 0.475 0.371 0.865 0.298 1.000 LPLA 0.573 0.584 0.4601 0.377 0.386 0.420 0.136 0.449 1.000 ATO 0.442 0.385 0.515 0.453 0.424 0.308 0.107 0.436 0.205 1.000 CNO 0.654 0.608 0.485 0.344 0.412 0.475 0.379 0.539 0.606 0.333 1.000 B F 1 J K L M Exhibit 10: ProValue Portfolio Model Expected Returns and Optimal Portfolio Weights Stock ROC PII MRC ETFC EGN USM BAH FNF LPLA ATO CNO Model Annual Expected Returns 33.00% 35.00% 20.00% 30.00% 22.00% 19.00% 22.00% 23.00% 24.00% 11.00% 33.00% Historical Annualized Std. Dev. 52.58% 40.74% 30.26% 49.54% 29.89% 25.45% 45.82% 19.92% 30.25% 14.56% 63.66% Desired Annual Portfolio Return 15.00% | 17.00% 19.00% 21.00% 23.00% 25.00% 27.00% 29.00% 31.00% 33.00% 35.00% Stock ROC PII MRC ETFC EGN USM BAH FNF LPLA ATO CNO Optimized Security Weights 6.2% 5.4% 4.5% 3.7% 2.9% 2.1% 1.3% 0.4% -0.4% -1.2% -2.0% -25.6% -22.2% -18.8% -15.4% -12.0% -8.6% -5.2% -1.9% 1.5% 4.9% 8.3% -35.3% -36.1% -37.0% -37.9% -38.7% -39.6% -40.4% -41.3% -42.2% -43.0% -43.9% -22.5% -22.3% -22.1% -21.9% -21.6% -21.4% -21.2% -21.0% -20.8% -20.6% -20.3% 9.7% 11.5% 13.3% 15.1% 16.9% 18.7% 20.5% 22.3% 24.1% 25.9% 27.7% -78.0% -85.2% -92.5% -99.7% -106.9% -114.1% -121.3% -128.5% -135.7% -143.0% -150.2% 49.8% 49.2% 48.5% 47.9% 47.3% 46.7% 46.0% 45.4% 44.8% 44.2% 43.5% 93.4% 108.9% 124.5% 140.0% 155.6% 171.1% 186.7% 202.2% 217.8% 233.3% 248.9% 49.7% 50.3% 50.9% 51.5% 52.0% 52.6% 53.2% 53.8% 54.3% 54.9% 55.5% 60.5% 48.9% 37.3% 25.7% 14.1% 2.5% -9.1% -20.7% -32.3% -43.9% -55.5% -7.9% -8.3% -8.7% -9.1% -9.6% -10.0% -10.4% -10.8% -11.2% -11.6% -12.0% Calculated Portfolio Standard Deivation using Optimized Weights 7.52% 8.70% 10.22% 11.94% 13.79% 15.72% 17.71% 19.74% 21.79% 23.87% 6.84% Exhibit 8: ProValue Portfolio Historical Statistics and Current Weights Stock ROC PII MRC ETFC EGN Average Monthly Returns 4.38% 4.78% 2.55% 1.88% 1.93% Historical Monthly Std. Dev. 15.18% 11.76% 8.74% 14.30% 8.63% Current Weights, 12/2013 9.55% | 11.16% 7.42% 14.05% 8.75% USM FNF LPLA 0.46% 3.03% 0.96% 1.97% 7.35% | 13.23% 5.75% 8.73% 8.65% 11.28% | 13.26% | 15.87% ATO 1.54% 4.20% 0.00% CNO 3.82% 18.38% 0.00% ETFC 0.710 0.553 0.588 1.000 Exhibit 9: ProValue Portfolio Correlations Correlations ROC PII MRC ROC 1.000 0.784 0.773 PII 1.000 0.630 MRC 1.000 ETFC EGN USM BAH FNF LPLA ATO CNO EGN 0.540 0.552 0.590 0.528 1.000 USM 0.312 0.168 0.234 0.285 0.357 1.000 BAH 0.536 0.551 0.510 0.585 0.476) 0.327 1.000 FNF 0.485 0.352 0.444 0.475 0.371 0.865 0.298 1.000 LPLA 0.573 0.584 0.4601 0.377 0.386 0.420 0.136 0.449 1.000 ATO 0.442 0.385 0.515 0.453 0.424 0.308 0.107 0.436 0.205 1.000 CNO 0.654 0.608 0.485 0.344 0.412 0.475 0.379 0.539 0.606 0.333 1.000 B F 1 J K L M Exhibit 10: ProValue Portfolio Model Expected Returns and Optimal Portfolio Weights Stock ROC PII MRC ETFC EGN USM BAH FNF LPLA ATO CNO Model Annual Expected Returns 33.00% 35.00% 20.00% 30.00% 22.00% 19.00% 22.00% 23.00% 24.00% 11.00% 33.00% Historical Annualized Std. Dev. 52.58% 40.74% 30.26% 49.54% 29.89% 25.45% 45.82% 19.92% 30.25% 14.56% 63.66% Desired Annual Portfolio Return 15.00% | 17.00% 19.00% 21.00% 23.00% 25.00% 27.00% 29.00% 31.00% 33.00% 35.00% Stock ROC PII MRC ETFC EGN USM BAH FNF LPLA ATO CNO Optimized Security Weights 6.2% 5.4% 4.5% 3.7% 2.9% 2.1% 1.3% 0.4% -0.4% -1.2% -2.0% -25.6% -22.2% -18.8% -15.4% -12.0% -8.6% -5.2% -1.9% 1.5% 4.9% 8.3% -35.3% -36.1% -37.0% -37.9% -38.7% -39.6% -40.4% -41.3% -42.2% -43.0% -43.9% -22.5% -22.3% -22.1% -21.9% -21.6% -21.4% -21.2% -21.0% -20.8% -20.6% -20.3% 9.7% 11.5% 13.3% 15.1% 16.9% 18.7% 20.5% 22.3% 24.1% 25.9% 27.7% -78.0% -85.2% -92.5% -99.7% -106.9% -114.1% -121.3% -128.5% -135.7% -143.0% -150.2% 49.8% 49.2% 48.5% 47.9% 47.3% 46.7% 46.0% 45.4% 44.8% 44.2% 43.5% 93.4% 108.9% 124.5% 140.0% 155.6% 171.1% 186.7% 202.2% 217.8% 233.3% 248.9% 49.7% 50.3% 50.9% 51.5% 52.0% 52.6% 53.2% 53.8% 54.3% 54.9% 55.5% 60.5% 48.9% 37.3% 25.7% 14.1% 2.5% -9.1% -20.7% -32.3% -43.9% -55.5% -7.9% -8.3% -8.7% -9.1% -9.6% -10.0% -10.4% -10.8% -11.2% -11.6% -12.0% Calculated Portfolio Standard Deivation using Optimized Weights 7.52% 8.70% 10.22% 11.94% 13.79% 15.72% 17.71% 19.74% 21.79% 23.87% 6.84% Exhibit 8: ProValue Portfolio Historical Statistics and Current Weights Stock ROC PII MRC ETFC EGN Average Monthly Returns 4.38% 4.78% 2.55% 1.88% 1.93% Historical Monthly Std. Dev. 15.18% 11.76% 8.74% 14.30% 8.63% Current Weights, 12/2013 9.55% | 11.16% 7.42% 14.05% 8.75% USM FNF LPLA 0.46% 3.03% 0.96% 1.97% 7.35% | 13.23% 5.75% 8.73% 8.65% 11.28% | 13.26% | 15.87% ATO 1.54% 4.20% 0.00% CNO 3.82% 18.38% 0.00%
Step by Step Solution
There are 3 Steps involved in it

Get step-by-step solutions from verified subject matter experts