

Question: For the provided T-x-y data for n-pentane (1) and acetone (2) at 750mmHg, compare the following activity coefficient models (plot each Txy diagram with the
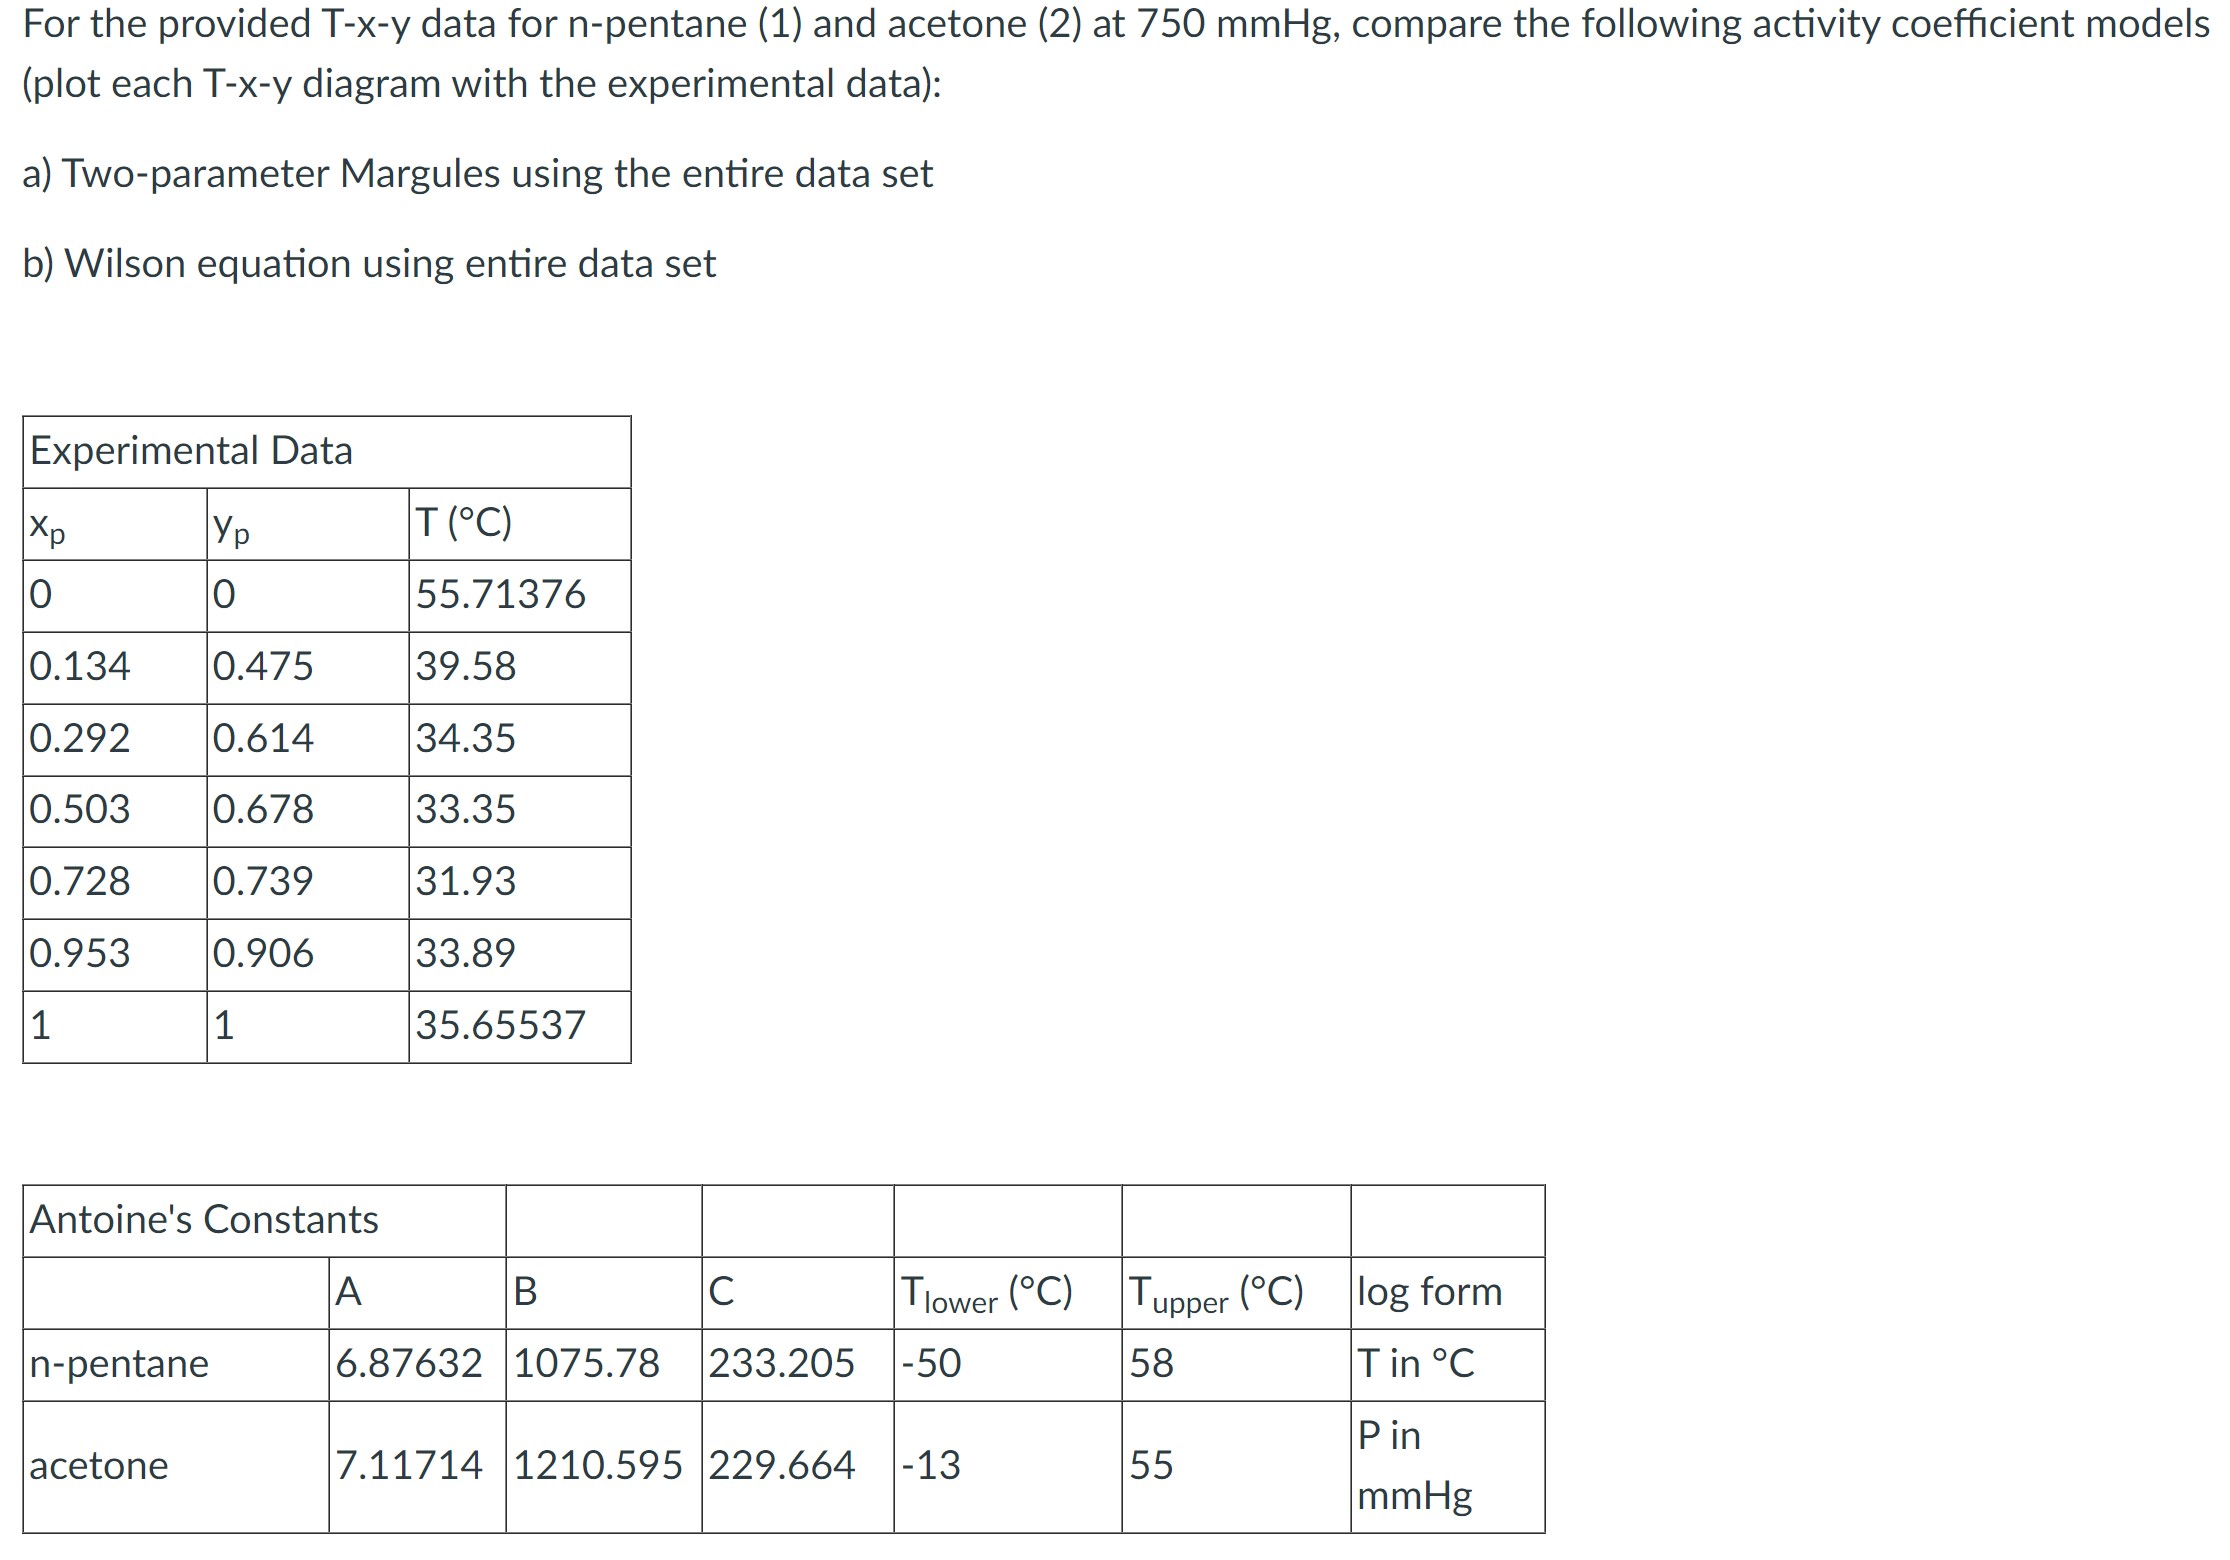
For the provided T-x-y data for n-pentane (1) and acetone (2) at 750mmHg, compare the following activity coefficient models (plot each Txy diagram with the experimental data): a) Two-parameter Margules using the entire data set b) Wilson equation using entire data set
Step by Step Solution
There are 3 Steps involved in it
1 Expert Approved Answer
Step: 1 Unlock

Question Has Been Solved by an Expert!
Get step-by-step solutions from verified subject matter experts
Step: 2 Unlock
Step: 3 Unlock