

Question: PLEASE ANSWER WITH MATLAB CODE 1. (25 pts) Activity coefficient y is an important thermodynamic parameter to describe nonideality of a liquid mixture. For a
PLEASE ANSWER WITH MATLAB CODE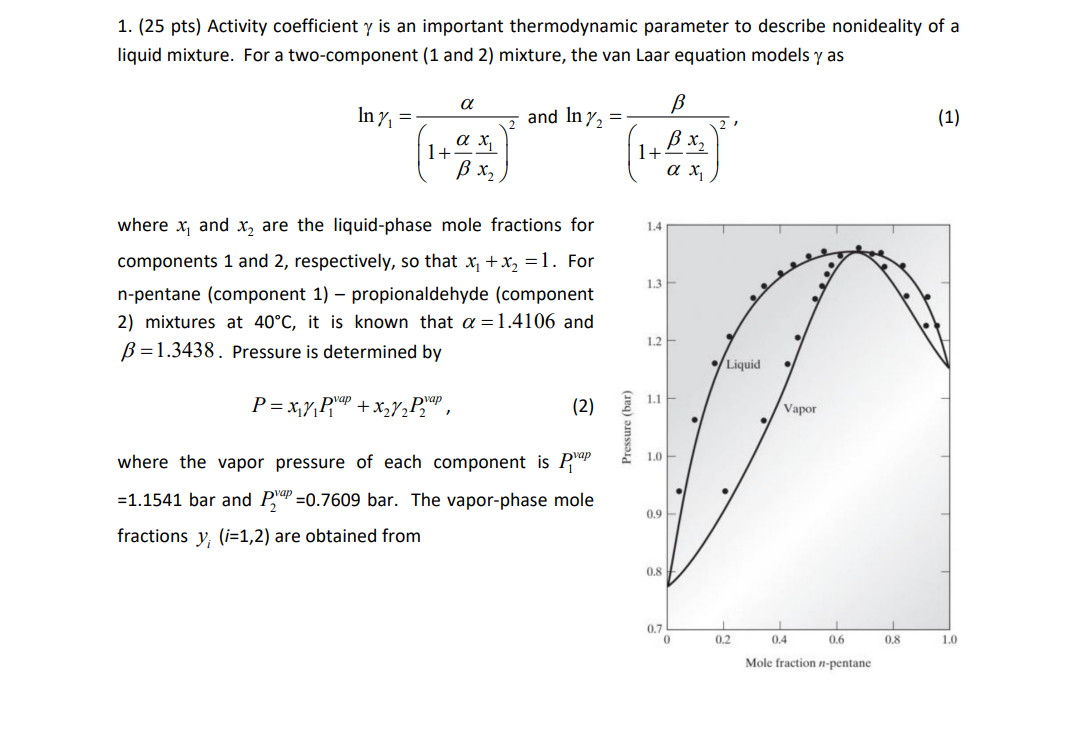
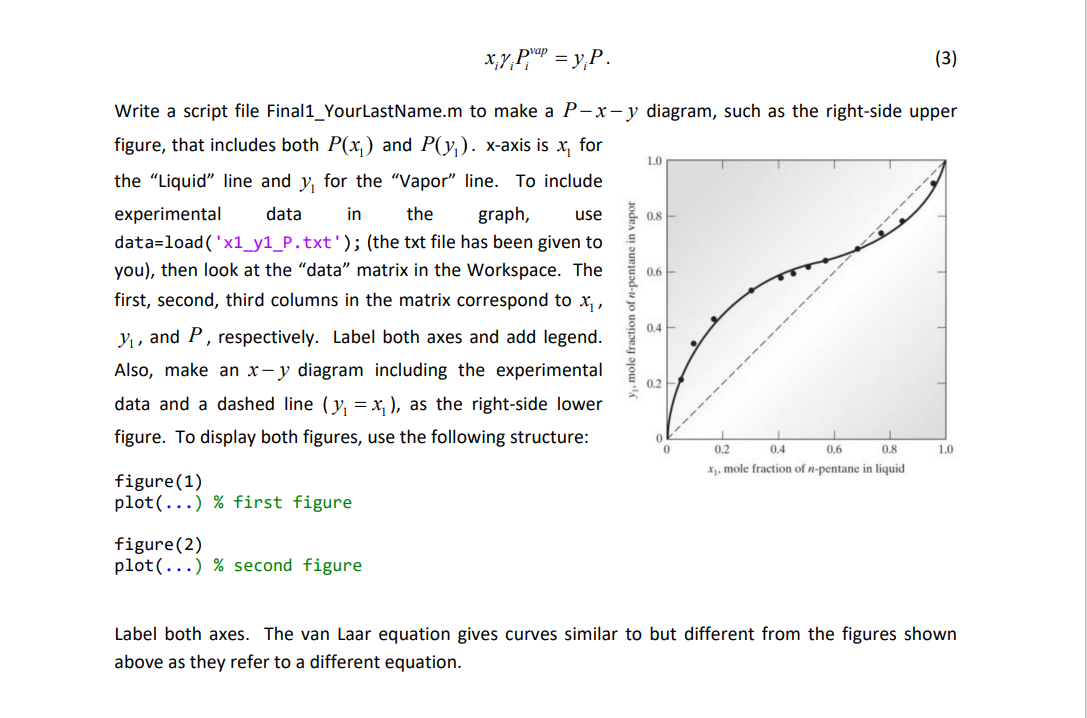
1. (25 pts) Activity coefficient y is an important thermodynamic parameter to describe nonideality of a liquid mixture. For a two-component (1 and 2) mixture, the van Laar equation models y as In y = and In y2 = (1) 27 ax 1+ x 11+ B x2 , 1.4 1.3 where x, and x, are the liquid-phase mole fractions for components 1 and 2, respectively, so that x1 + x2 =1. For n-pentane (component 1) propionaldehyde (component 2) mixtures at 40C, it is known that a = 1.4106 and B=1.3438. Pressure is determined by 1.2 Liquid P=xy p'ap + x2y2P. Pap. 1.1 (2) Vapor Pressure (bar) 1.0 where the vapor pressure of each component is prap =1.1541 bar and Pap =0.7609 bar. The vapor-phase mole fractions y; (i=1,2) are obtained from 0.9 0.8 0.7 0 0.2 0.4 0.6 0.8 1.0 Mole fraction n-pentane x;y;p"! = y;P. (3) 1.0 use 0.8 In-pentane in vapor 0.6 Write a script file Final1_YourLastName.m to make a P-x-y diagram, such as the right-side upper figure, that includes both P(x) and P(y). x-axis is x, for the "Liquid" line and y, for the "Vapor line. To include experimental data in the graph, data=load('x1_y1_P.txt'); (the txt file has been given to you), then look at the "data" matrix in the Workspace. The first, second, third columns in the matrix correspond to x,, Y, and P, respectively. Label both axes and add legend. Also, make an x-y diagram including the experimental data and a dashed line (y = x;), as the right-side lower figure. To display both figures, use the following structure: Xi, mole fraction of n-pentane in liquid figure(1) plot(...) % first figure 0.4 mole fraction 0.2 0 1 0.2 0.4 0.6 0.8 1.0 figure(2) plot(...) % second figure Label both axes. The van Laar equation gives curves similar to but different from the figures shown above as they refer to a different equation. 1. (25 pts) Activity coefficient y is an important thermodynamic parameter to describe nonideality of a liquid mixture. For a two-component (1 and 2) mixture, the van Laar equation models y as In y = and In y2 = (1) 27 ax 1+ x 11+ B x2 , 1.4 1.3 where x, and x, are the liquid-phase mole fractions for components 1 and 2, respectively, so that x1 + x2 =1. For n-pentane (component 1) propionaldehyde (component 2) mixtures at 40C, it is known that a = 1.4106 and B=1.3438. Pressure is determined by 1.2 Liquid P=xy p'ap + x2y2P. Pap. 1.1 (2) Vapor Pressure (bar) 1.0 where the vapor pressure of each component is prap =1.1541 bar and Pap =0.7609 bar. The vapor-phase mole fractions y; (i=1,2) are obtained from 0.9 0.8 0.7 0 0.2 0.4 0.6 0.8 1.0 Mole fraction n-pentane x;y;p"! = y;P. (3) 1.0 use 0.8 In-pentane in vapor 0.6 Write a script file Final1_YourLastName.m to make a P-x-y diagram, such as the right-side upper figure, that includes both P(x) and P(y). x-axis is x, for the "Liquid" line and y, for the "Vapor line. To include experimental data in the graph, data=load('x1_y1_P.txt'); (the txt file has been given to you), then look at the "data" matrix in the Workspace. The first, second, third columns in the matrix correspond to x,, Y, and P, respectively. Label both axes and add legend. Also, make an x-y diagram including the experimental data and a dashed line (y = x;), as the right-side lower figure. To display both figures, use the following structure: Xi, mole fraction of n-pentane in liquid figure(1) plot(...) % first figure 0.4 mole fraction 0.2 0 1 0.2 0.4 0.6 0.8 1.0 figure(2) plot(...) % second figure Label both axes. The van Laar equation gives curves similar to but different from the figures shown above as they refer to a different equation
Step by Step Solution
There are 3 Steps involved in it

Get step-by-step solutions from verified subject matter experts