

Question: For the second questions, I have the weekly aggregate returns for all the stocks. How can I calculate the optimal risky portfolio in excel? Through
For the second questions, I have the weekly aggregate returns for all the stocks. How can I calculate the optimal risky portfolio in excel?
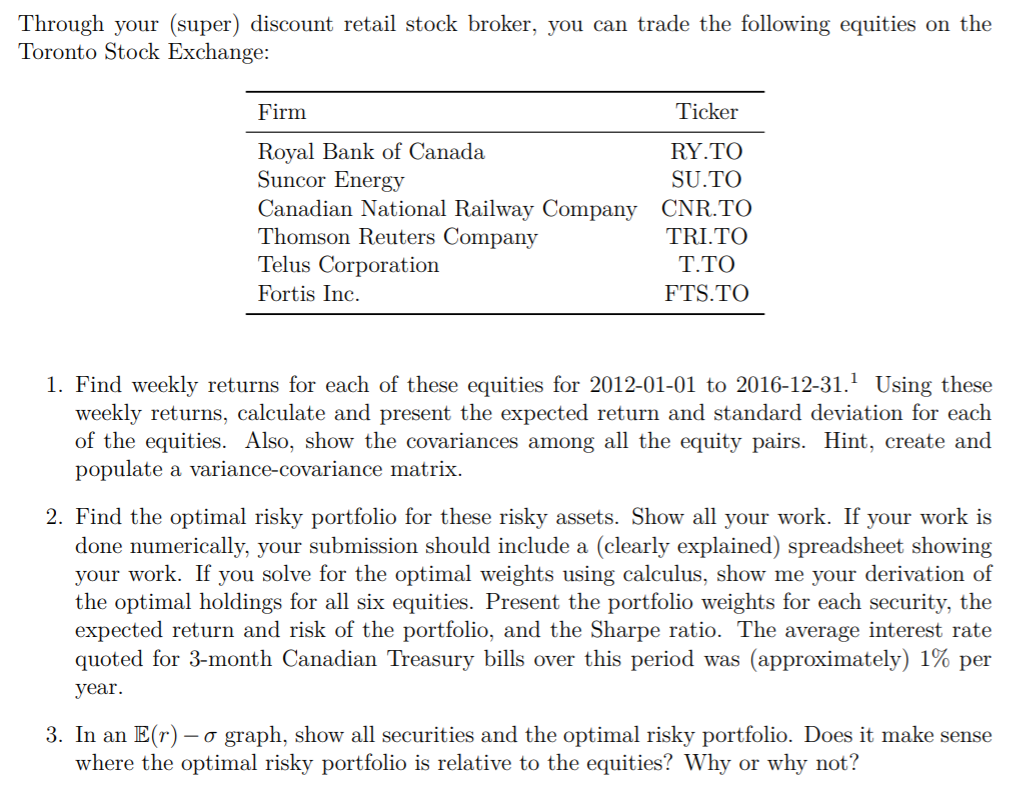
Through your (super) discount retail stock broker, you can trade the following equities on the Toronto Stock Exchange: Firm Ticker Royal Bank of Canada RY.TO Suncor Energy SU.TO Canadian National Railway Company CNR.TO Thomson Reuters Company TRI.TO Telus Corporation T.TO Fortis Inc. FTS.TO 1. Find weekly returns for each of these equities for 2012-01-01 to 2016-12-31. Using these weekly returns, calculate and present the expected return and standard deviation for each of the equities. Also, show the covariances among all the equity pairs. Hint, create and populate a variance-covariance matrix. 2. Find the optimal risky portfolio for these risky assets. Show all your work. If your work is done numerically, your submission should include a (clearly explained) spreadsheet showing your work. If you solve for the optimal weights using calculus, show me your derivation of the optimal holdings for all six equities. Present the portfolio weights for each security, the expected return and risk of the portfolio, and the Sharpe ratio. The average interest rate quoted for 3-month Canadian Treasury bills over this period was (approximately) 1% per year. 3. In an E(r) - o graph, show all securities and the optimal risky portfolio. Does it make sense where the optimal risky portfolio is relative to the equities? Why or why not? Through your (super) discount retail stock broker, you can trade the following equities on the Toronto Stock Exchange: Firm Ticker Royal Bank of Canada RY.TO Suncor Energy SU.TO Canadian National Railway Company CNR.TO Thomson Reuters Company TRI.TO Telus Corporation T.TO Fortis Inc. FTS.TO 1. Find weekly returns for each of these equities for 2012-01-01 to 2016-12-31. Using these weekly returns, calculate and present the expected return and standard deviation for each of the equities. Also, show the covariances among all the equity pairs. Hint, create and populate a variance-covariance matrix. 2. Find the optimal risky portfolio for these risky assets. Show all your work. If your work is done numerically, your submission should include a (clearly explained) spreadsheet showing your work. If you solve for the optimal weights using calculus, show me your derivation of the optimal holdings for all six equities. Present the portfolio weights for each security, the expected return and risk of the portfolio, and the Sharpe ratio. The average interest rate quoted for 3-month Canadian Treasury bills over this period was (approximately) 1% per year. 3. In an E(r) - o graph, show all securities and the optimal risky portfolio. Does it make sense where the optimal risky portfolio is relative to the equities? Why or why not
Step by Step Solution
There are 3 Steps involved in it

Get step-by-step solutions from verified subject matter experts