

Question: For the system shown below do the following: a) Plot the Bode log-magnitude and phase plots b) Find the range of K for stability
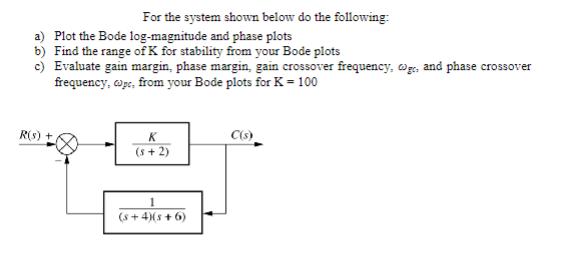
For the system shown below do the following: a) Plot the Bode log-magnitude and phase plots b) Find the range of K for stability from your Bode plots c) Evaluate gain margin, phase margin, gain crossover frequency, @g, and phase crossover frequency, wpc, from your Bode plots for K= 100 R(s) + K (s + 2) (s+4)(s+6) C(s)
Step by Step Solution
★★★★★
3.47 Rating (150 Votes )
There are 3 Steps involved in it
1 Expert Approved Answer
Step: 1 Unlock

Question Has Been Solved by an Expert!
Get step-by-step solutions from verified subject matter experts
Step: 2 Unlock
Step: 3 Unlock