

Question: For the table below select the correct scatter plot of the data Choose the correlation depicted by the data You will select TWO answers for
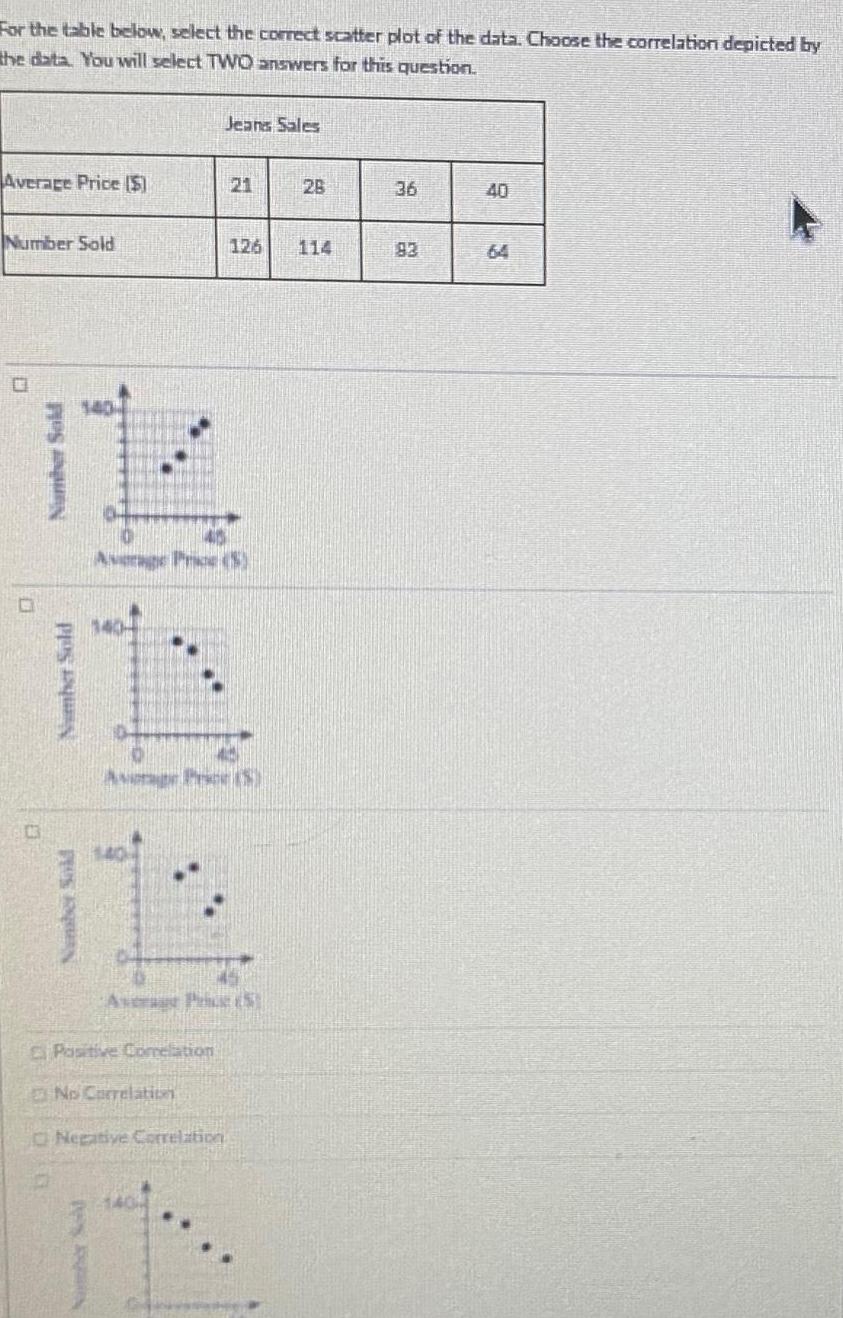

For the table below select the correct scatter plot of the data Choose the correlation depicted by the data You will select TWO answers for this question Average Price Number Sold Number Sold Number Sold PROS ENQUAN 11 112 Average Price 8 Jeans Sales Positive Comeliation RAGHIN Average Price S No Correlation 126 114 Avtar Price 5 Negative Correlation 28 36 83 40 64
Step by Step Solution
There are 3 Steps involved in it
1 Expert Approved Answer
Step: 1 Unlock

Question Has Been Solved by an Expert!
Get step-by-step solutions from verified subject matter experts
Step: 2 Unlock
Step: 3 Unlock