

Question: - For the table data below, please help me create the Friction factor vs Reynold number graph. - After creating the graph, please discuss your
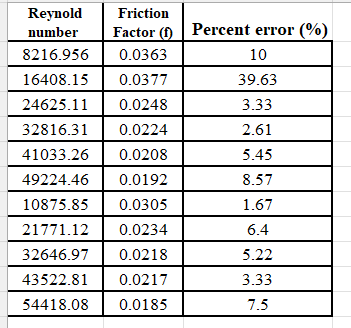
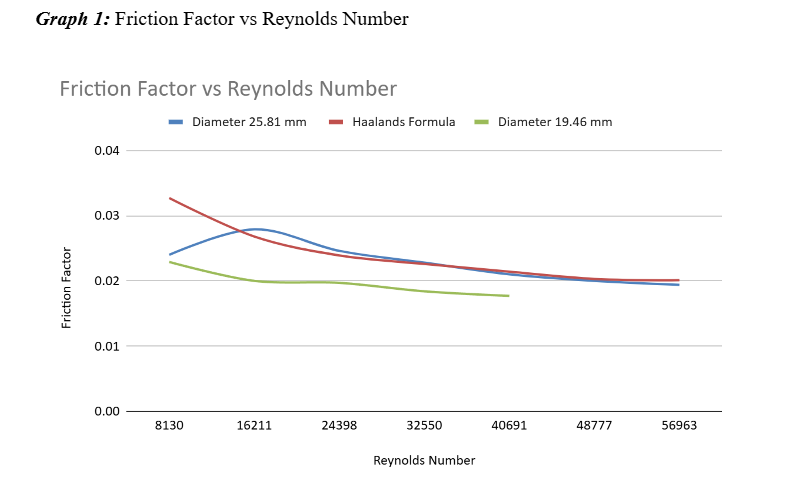
- For the table data below, please help me create the "Friction factor vs Reynold number graph".
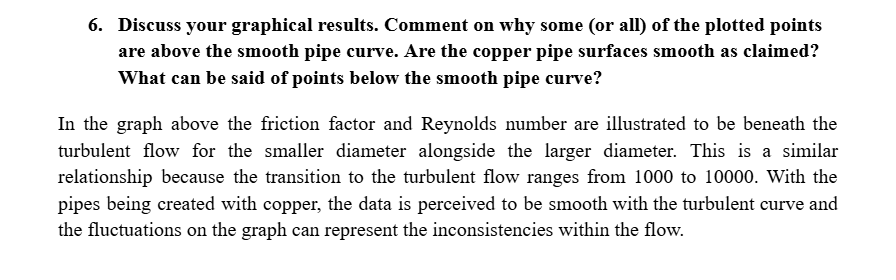
- After creating the graph, please discuss your graphical results. Comment on why some (or all) of the plotted points are above the smooth pipe curve. Are the copper pipe surfaces smooth as claimed? What can be said of points below the smooth pipe curve?
Step by Step Solution
There are 3 Steps involved in it
1 Expert Approved Answer
Step: 1 Unlock

Question Has Been Solved by an Expert!
Get step-by-step solutions from verified subject matter experts
Step: 2 Unlock
Step: 3 Unlock