

Question: For the test errors, the c-chart with control limits that contain 99.73% of the random variation in test scores is: UCL Lc=69.51 errors (round your
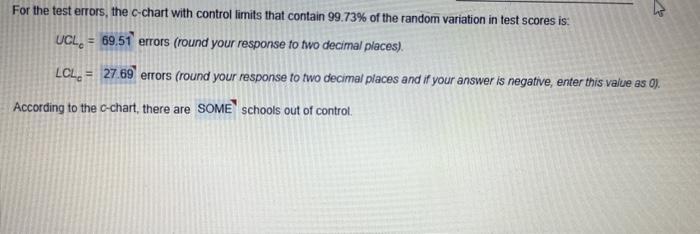

For the test errors, the c-chart with control limits that contain 99.73% of the random variation in test scores is: UCL Lc=69.51 errors (round your response to two decimal places). LCLc= errors (round your response to two decimal places and if your answer is negative, enter this value as 0 ). According to the c-chart, there are schools out of control. each elerientary schicol yieldod the following data: \begin{tabular}{c|c|c} \hline School & No, or Test Finors \\ \hline A & 65 \\ B & 14 \\ C & 36 \\ D & 43 \\ E & 55 \\ \hline \end{tabular}
Step by Step Solution
There are 3 Steps involved in it
1 Expert Approved Answer
Step: 1 Unlock

Question Has Been Solved by an Expert!
Get step-by-step solutions from verified subject matter experts
Step: 2 Unlock
Step: 3 Unlock