

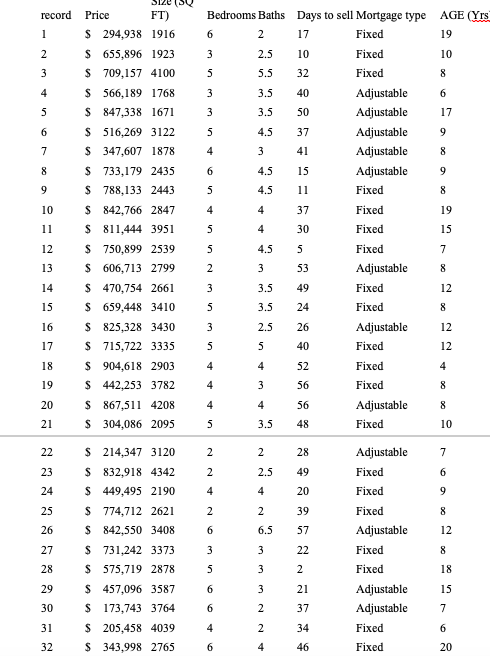
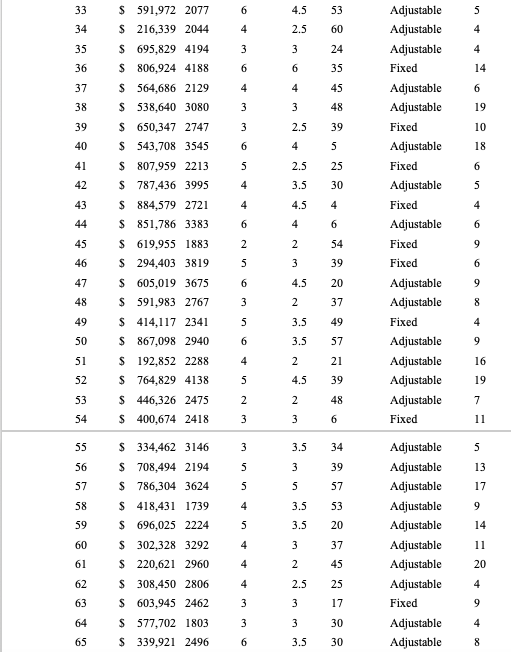
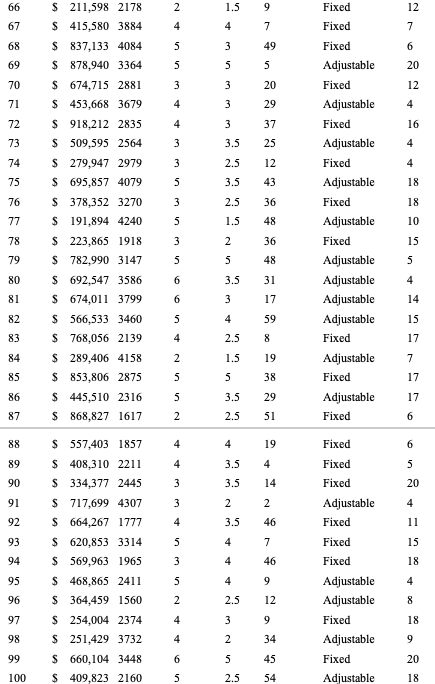
Question: For the variable price, select an appropriate class interval and organize the selling prices into a frequency distribution. Around what values of price do the
For the variable price, select an appropriate class interval and organize the selling prices into a frequency distribution. Around what values of price do the data tend to cluster? Based on the frequency distribution, what is the typical selling price. Draw a cumulative relative frequency distribution. Using this distribution, fifty percent of the homes sold for what price or less? Estimate the lower price of the top ten percent of homes sold. About what percent of the homes sold for less than $300,000? Write a brief report summarizing your findings.
In addition, the board has asked you to refer to the variable bedrooms and full baths. For each variable, provide a bar chart showing the number of homes sold with 2, 3, 4 or more bedrooms and baths. You should have a separate bar chart for each variable. (2.5 baths means there is 2 full baths and one-half bath. This should be counted as 2 full baths for your analysis) Write a description of the distributions
Step by Step Solution
There are 3 Steps involved in it

Get step-by-step solutions from verified subject matter experts