

Question: For the wall shown in Figure 3 , a . plot the static lateral earth pressure diagram, and find the location of the resultant lateral
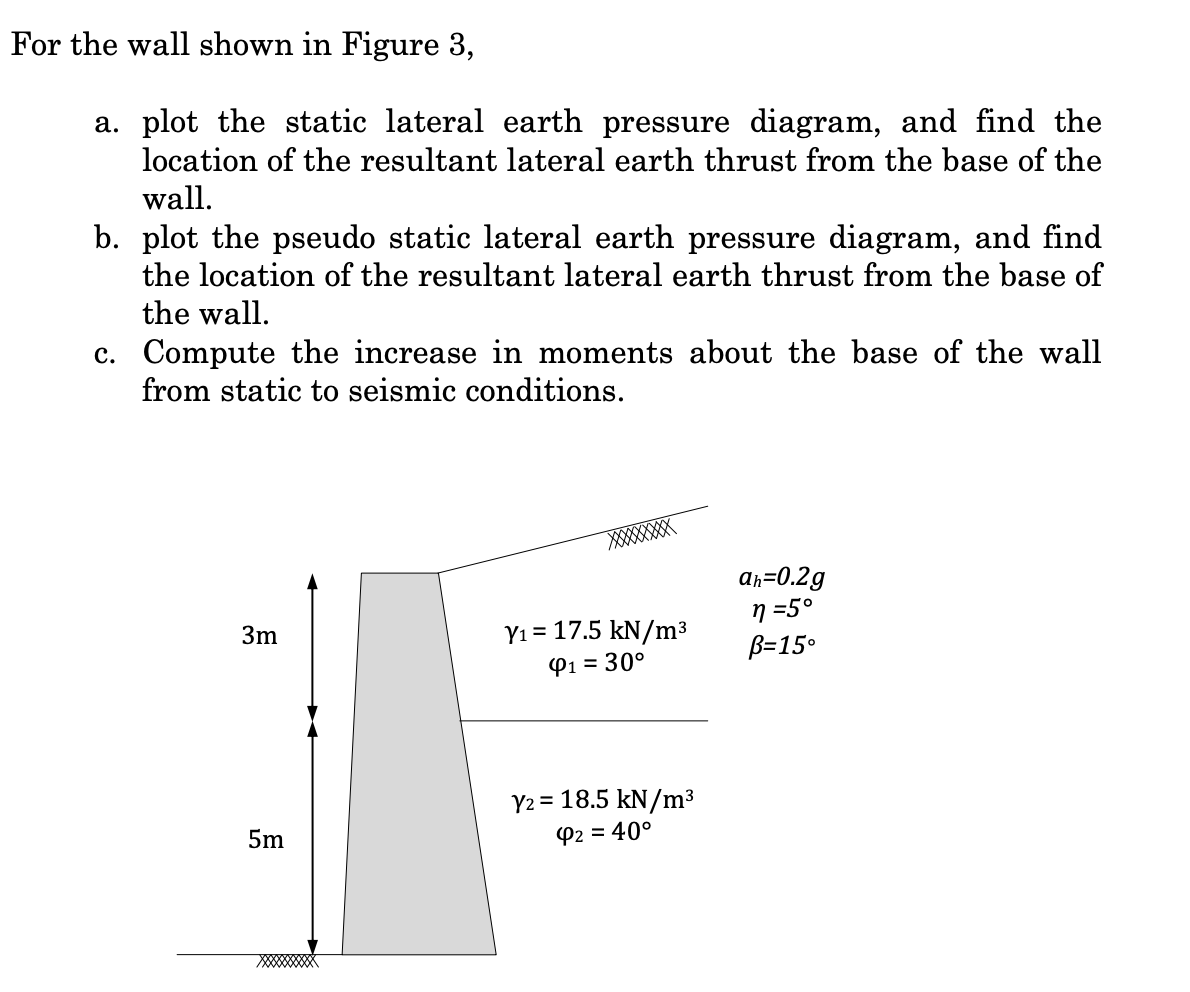
For the wall shown in Figure
a plot the static lateral earth pressure diagram, and find the
location of the resultant lateral earth thrust from the base of the
wall.
b plot the pseudo static lateral earth pressure diagram, and find
the location of the resultant lateral earth thrust from the base of
the wall.
c Compute the increase in moments about the base of the wall
from static to seismic conditions.
Step by Step Solution
There are 3 Steps involved in it
1 Expert Approved Answer
Step: 1 Unlock

Question Has Been Solved by an Expert!
Get step-by-step solutions from verified subject matter experts
Step: 2 Unlock
Step: 3 Unlock