

Question: For this assignment you need to download the pivot table of MLB stats I put in Dropbox. The intent is to use of big data
For this assignment you need to download the pivot table of MLB stats I put in Dropbox. The intent is to use of big data tools to analyze the Pgh. Pirates brand utilizing a perceptual map, conjoint analysis and a pivot table.
- For the Perceptual map section you are to use excel to create two Maps The first map will show where Pirates are relative to ten other teams in their market size (size of city the team resides in). Use payroll as the bubble, (typically reserved for Market percentage), 2020 wins and attendance as the x and y axis.
- Write a brief summary of where they are in relation to everyone else and understanding their position. Then state what would be their value proposition can/should be due to the difference position they hold
- The second map is to compare the Pirates to five other summer activities that Pittsburghers could do instead of the Pirates-Kennywood, Zoo, Concert, All day duck tour and The Symphony. The X and Y axis can be cost and culture with the bubble being Popularity (attendance for the year).
- Write a brief summary of where they are in relation to everyone else and understanding their position. Then state what would be their value proposition can/should be due to the difference position they hold
- Create a conjoint analysis with attribute cells of at least three attributes (reasons people go to see the Pirates). You will use the primary market research data we have for 18-25 years old and their attributes. You will create a conjoint analysis and then you will create a bar graph to show the preferences that were uncovered by the analysis.
- NOTE: Explain how backchecking through follow-up control model should and could be done to assure the analysis is showing viable results
- Create a pivot table of MLB stats and salaries as if every player is a free agent. Cut the top three salaried players for the Pittsburgh Pirates and replace them with a cheaper version (must play the same position) based on stats and position, show your work and explain what you did.
Give a final summary as to how and what you would suggest the to maximize profit by using to focus on attribute wise (refer to your conjoint analysis, where they are in terms of the two perceptual maps abased on that data, what they could do to move their bubble to a blue ocean and finally, how the Pivot table will show what they need to do in terms of payroll to maximize profit but cutting three expensive players and replacing them with three cheaper versions.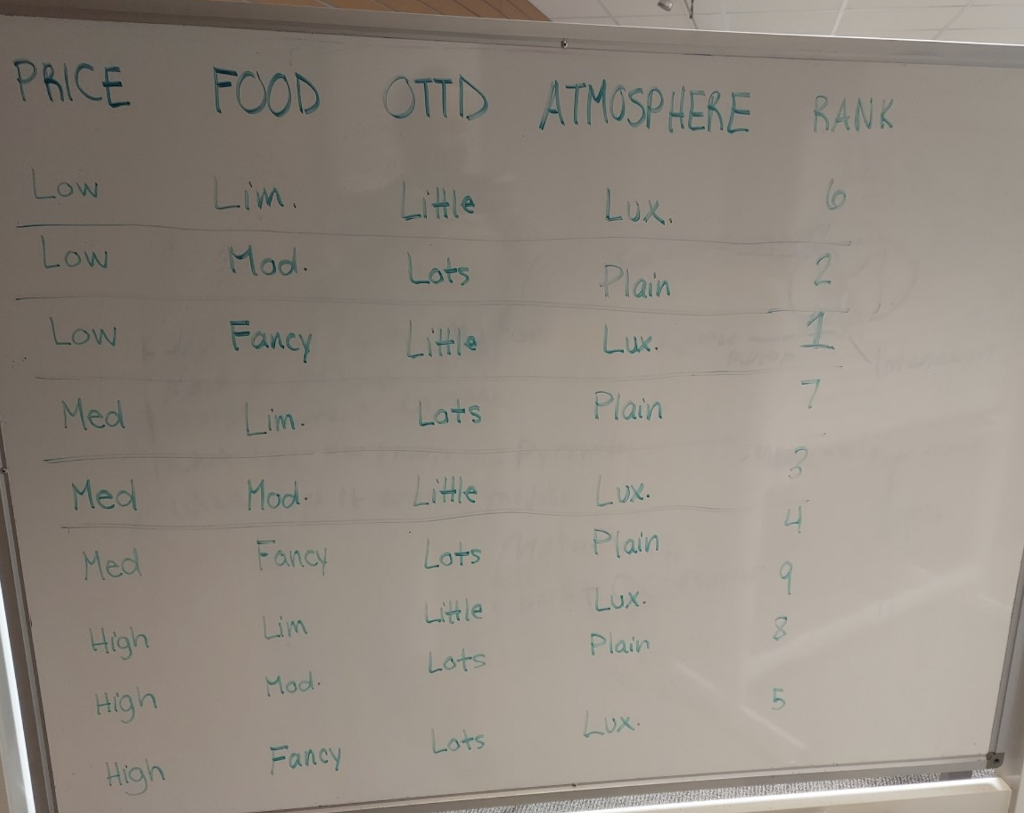
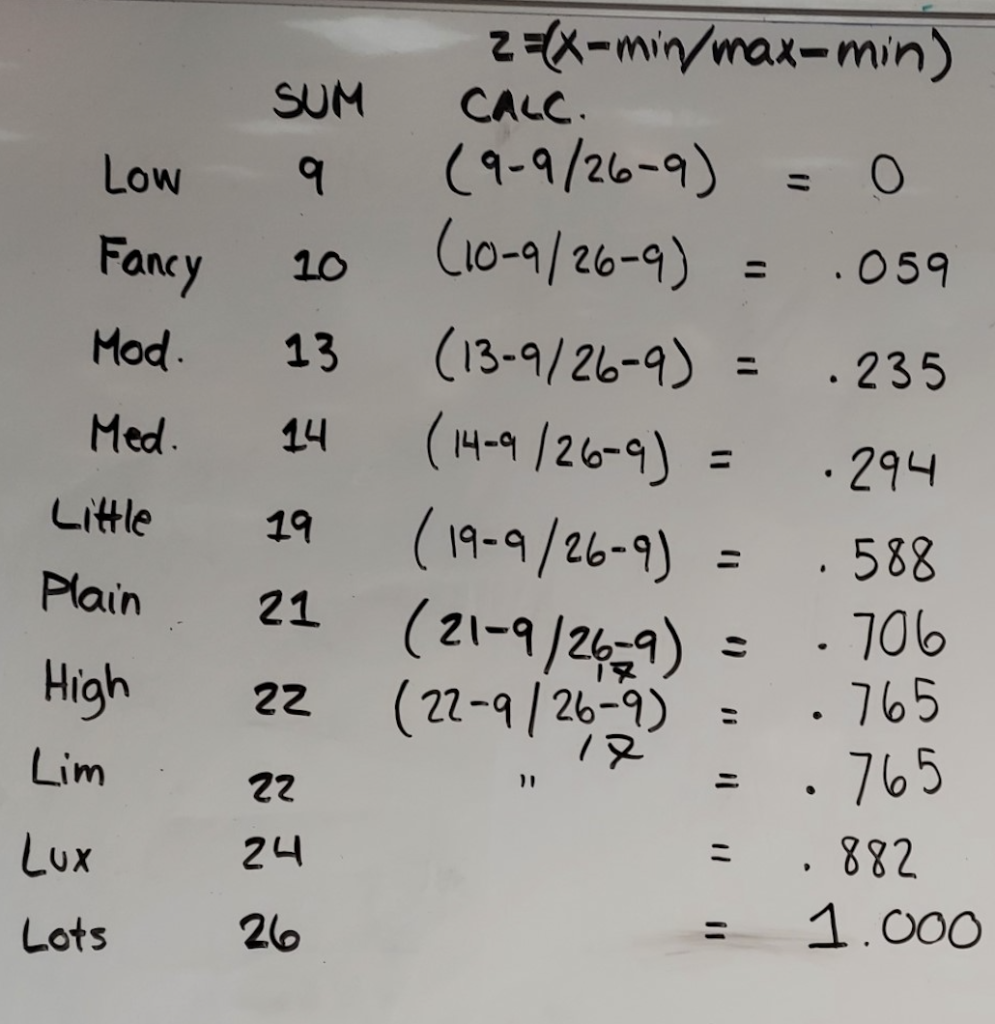
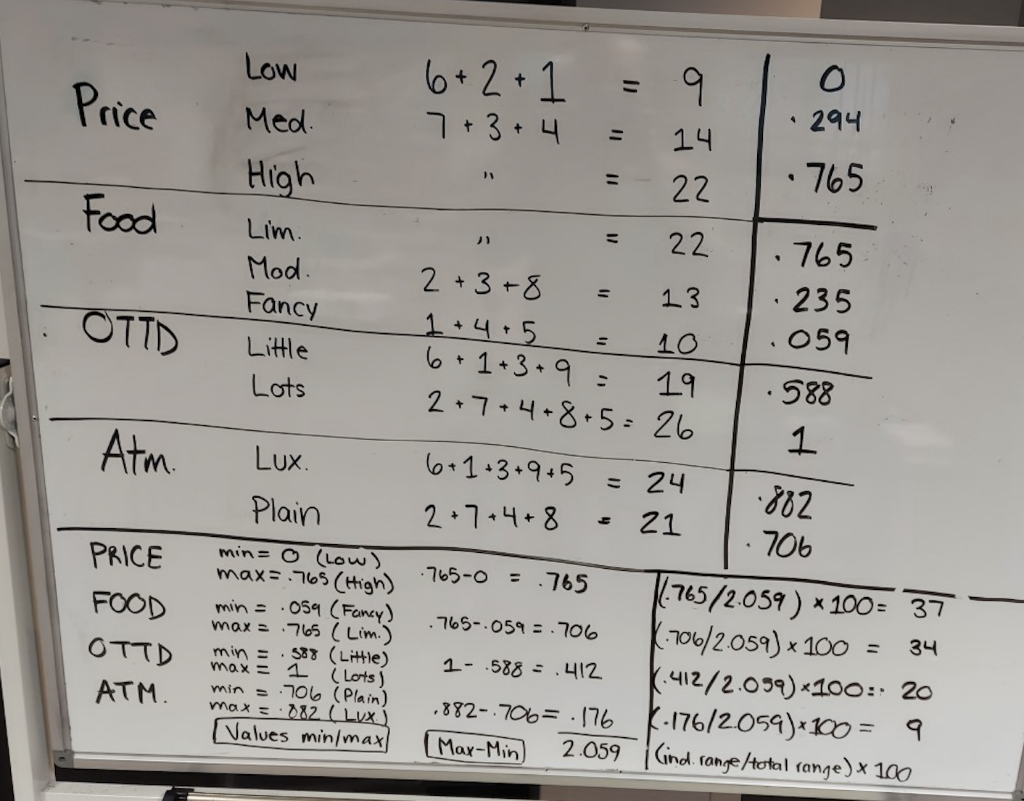
PRICE FOOD OTTD ATMOSPHERE RANK Low Lux. Little Lats Low Mad. Plain 2 Low Fancy Lux. - Med Lim. Lats Plain Med Lux. Mod. Fancy 4. Med Lots Plain 9 Lux. Lim High Little Lots Plain Mod. High Lux. Lots Fancy High Low Fancy Mod. Med. 14. 2=(= min/max-min) SUM CALC. 9 (9-9/26-9) O 10 ) = .059 13 (13-9/26-9) = .235 (14-9 126-9) = 294 (19-9/26-9) = .588 21 . 706 (22-9126-9 . 765 765 882 26 1.000 Little 19 Plain 22 High Lim 17 22 24 Lux Lots Price 11 765 Food . OTTD O Low 6+2+ 294 Med. 7 + 3 + 4 14. High 22 Lim. 22 . 765 Mod. 2 + 3 +8 13 235 Fancy 1 + 4 + 5 10 059 Little 6 + 1 + 3 + 9 = 19 588 Lots 2+7+4+8+5=26 1 Lux. 6+1 +3+9+5 = 24 .802 Plain 2+7+4+ 8 21 706 min= 0 (Low) max=.765 (High) -765-0 = .765 |(765/2.059) * 100 = 37 min = .059 (Fancy) .765-059 = .706 max= 1765 (Lim.) 1.706/2.059) x 100 34 min = 588 (Little) 1- .588 = .412 max = 1 (Lots } K.412/2.059) *100:: 20 min = .706 (Plain) max = 082 (Lux 1882-.706= .176 *.176/2059)*100 = 9 Values min/max Max-Min) 2.059 Cind. range /total range) x 100 Atm. PRICE FOOD OTTO ) ATM. PRICE FOOD OTTD ATMOSPHERE RANK Low Lux. Little Lats Low Mad. Plain 2 Low Fancy Lux. - Med Lim. Lats Plain Med Lux. Mod. Fancy 4. Med Lots Plain 9 Lux. Lim High Little Lots Plain Mod. High Lux. Lots Fancy High Low Fancy Mod. Med. 14. 2=(= min/max-min) SUM CALC. 9 (9-9/26-9) O 10 ) = .059 13 (13-9/26-9) = .235 (14-9 126-9) = 294 (19-9/26-9) = .588 21 . 706 (22-9126-9 . 765 765 882 26 1.000 Little 19 Plain 22 High Lim 17 22 24 Lux Lots Price 11 765 Food . OTTD O Low 6+2+ 294 Med. 7 + 3 + 4 14. High 22 Lim. 22 . 765 Mod. 2 + 3 +8 13 235 Fancy 1 + 4 + 5 10 059 Little 6 + 1 + 3 + 9 = 19 588 Lots 2+7+4+8+5=26 1 Lux. 6+1 +3+9+5 = 24 .802 Plain 2+7+4+ 8 21 706 min= 0 (Low) max=.765 (High) -765-0 = .765 |(765/2.059) * 100 = 37 min = .059 (Fancy) .765-059 = .706 max= 1765 (Lim.) 1.706/2.059) x 100 34 min = 588 (Little) 1- .588 = .412 max = 1 (Lots } K.412/2.059) *100:: 20 min = .706 (Plain) max = 082 (Lux 1882-.706= .176 *.176/2059)*100 = 9 Values min/max Max-Min) 2.059 Cind. range /total range) x 100 Atm. PRICE FOOD OTTO ) ATM
Step by Step Solution
There are 3 Steps involved in it

Get step-by-step solutions from verified subject matter experts