

Question: For this case study can you double check if my answers are correct and if my calculations are correct and my format is correct? Identify
For this case study can you double check if my answers are correct and if my calculations are correct and my format is correct?
Identify all the relevant hypotheses. (Hint: There is a hypotheses involving population mean and there is another hypotheses involving the population proportion)
Write the null hypothesis and alternative hypothesis using the statistical notation (for the hypotheses that involves the population mean). Use all the relevant statistical notation.
Write the null hypothesis and alternative hypothesis using the statistical notation (for the hypotheses that involves the population proportion). Use all the relevant statistical notation.
Perform the hypothesis test for the hypotheses that involve population mean.
Perform the hypothesis test for the hypotheses that involve population proportion.
Summarize all the findings in a well written report.
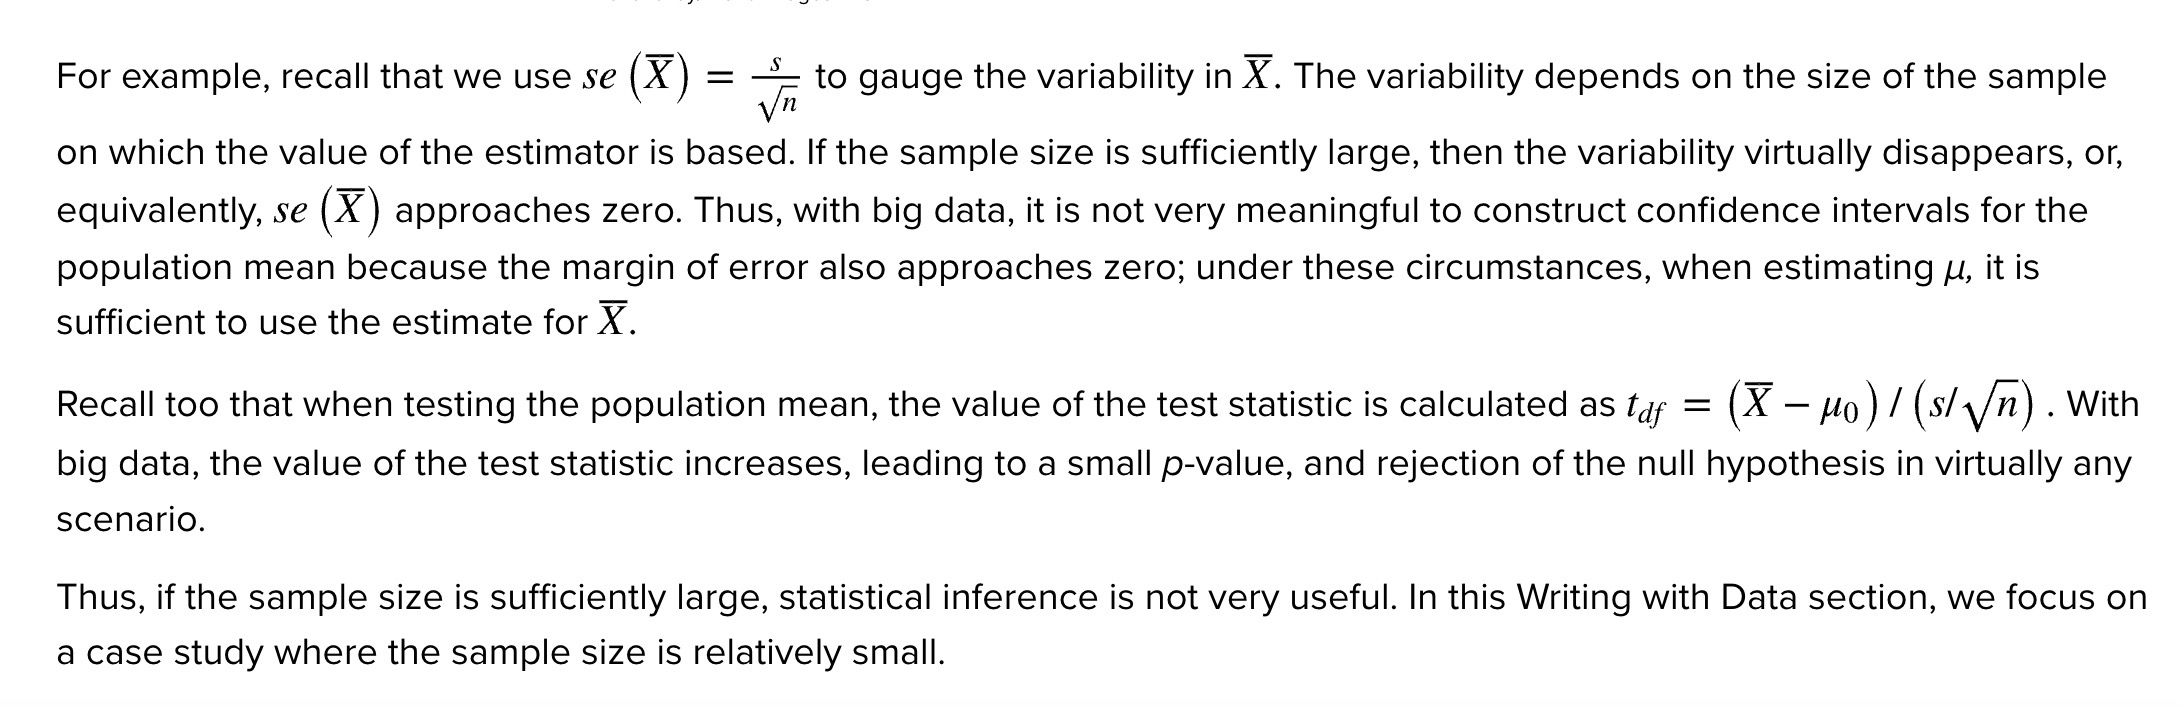
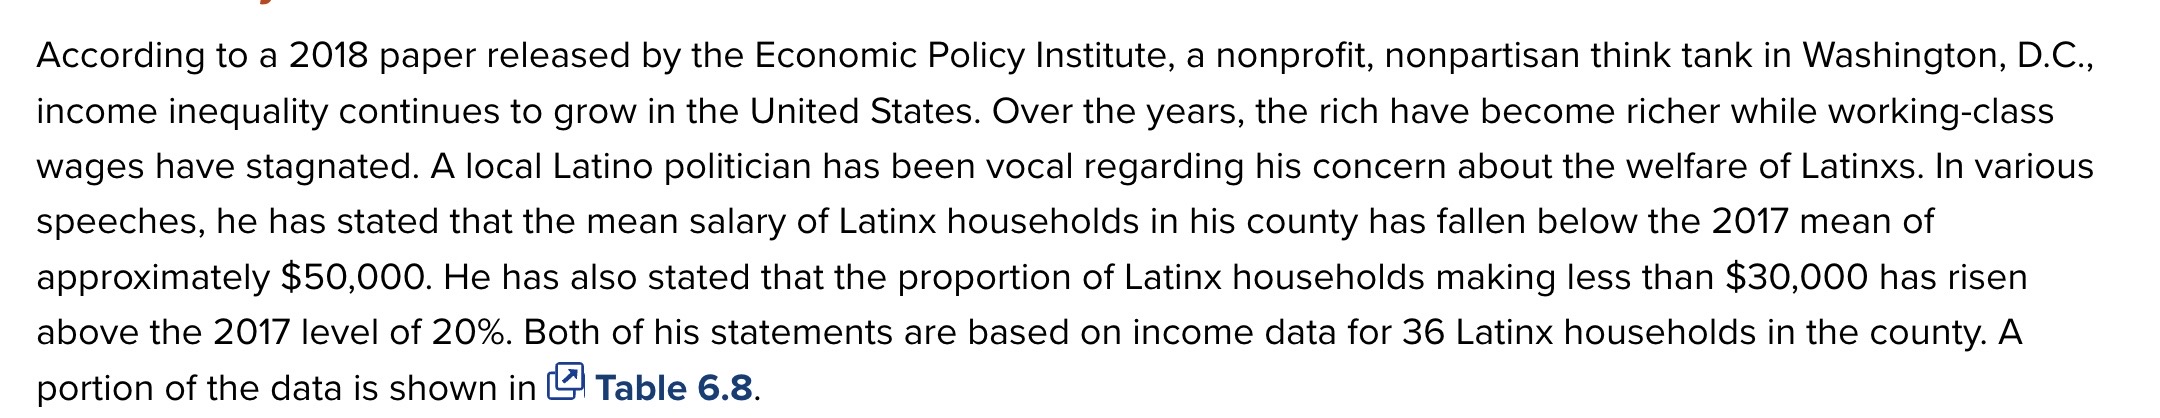


For example, recall that we use se ()_() = -L to gauge the variability in X. The variability depends on the size of the sample Vn on which the value of the estimator is based. If the sample size is sufficiently large, then the variability virtually disappears, or, equivalently, se ()_() approaches zero. Thus, with big data, it is not very meaningful to construct confidence intervals for the population mean because the margin of error also approaches zero; under these circumstances, when estimating y, it is sufficient to use the estimate for X. Recall too that when testing the population mean, the value of the test statistic is calculated as ;s = ()_( - ,uo) / (s/\\/) . With big data, the value of the test statistic increases, leading to a small p-value, and rejection of the null hypothesis in virtually any scenario. Thus, if the sample size is sufficiently large, statistical inference is not very useful. In this Writing with Data section, we focus on a case study where the sample size is relatively small. According to a 2018 paper released by the Economic Policy Institute, a nonprofit, nonpartisan think tank in Washington, D.C,, income inequality continues to grow in the United States. Over the years, the rich have become richer while working-class wages have stagnated. A local Latino politician has been vocal regarding his concern about the welfare of Latinxs. In various speeches, he has stated that the mean salary of Latinx households in his county has fallen below the 2017 mean of approximately $50,000. He has also stated that the proportion of Latinx households making less than $30,000 has risen above the 2017 level of 20%. Both of his statements are based on income data for 36 Latinx households in the county. A portion of the data is shown in (5! Table 6.8. Trevor Jones is a newspaper reporter who is interested in verifying the concerns of the local politician. He uses the sample information to determine if the mean income of Latinx households has fallen below the 2017 level of $50,000 and if the percentage of Latinx households making less than $30,000 has risen above 20%. \f
Step by Step Solution
There are 3 Steps involved in it

Get step-by-step solutions from verified subject matter experts