

Question: For this data do the following: 1. Choose a right type of a graph 2. Create a draft version of a graph (or graphs): Feel
For this data do the following:
1. Choose a right type of a graph 2. Create a draft version of a graph (or graphs): Feel free to generate a series of graphs where each graph shows just one aspect. 3. Once you create a draft version of chart, then apply three steps to improve the chart. - Remove clutters - Minimize eye movements and add visual cues by utilizing pre-attentive attributes. - Add story 5. add story mentioned above. It means that you need to include the followings (Context, finding, interpretation, and answers on so what question.) Among these four elements, Context and Answers on So What questions should be shown in your graphs(charts) as narratives. Findings and interpretation.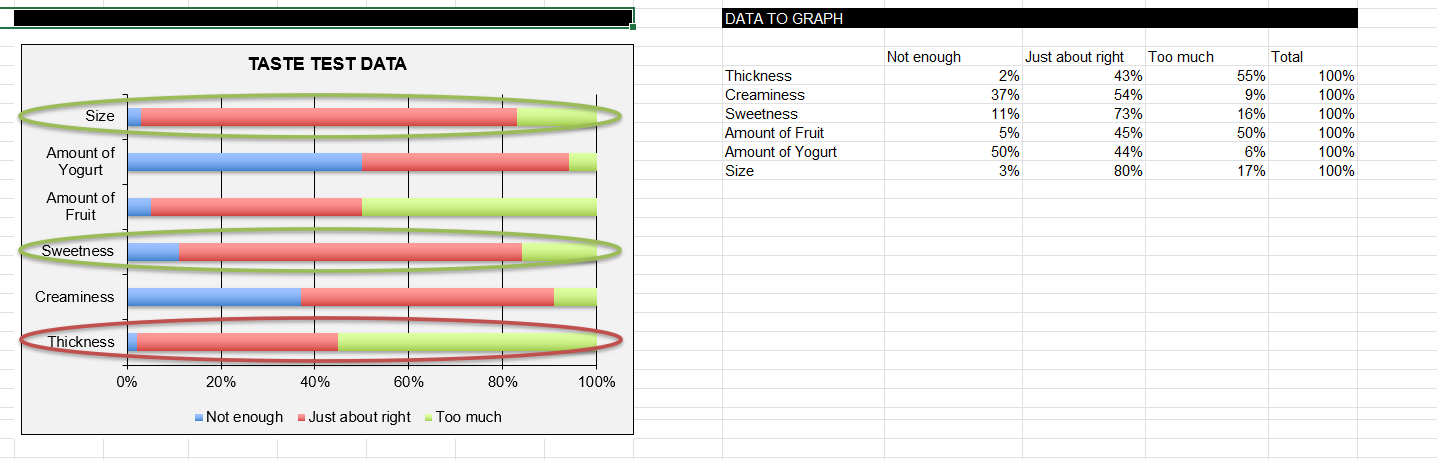
DATA TO GRAPH
Step by Step Solution
There are 3 Steps involved in it

Get step-by-step solutions from verified subject matter experts