

Question: For this exercise you would need to use the spreadsheet ps 2 . xls posted on the Blackboard. The file contains information about monthly returns
For this exercise you would need to use the spreadsheet psxls posted on the Blackboard.
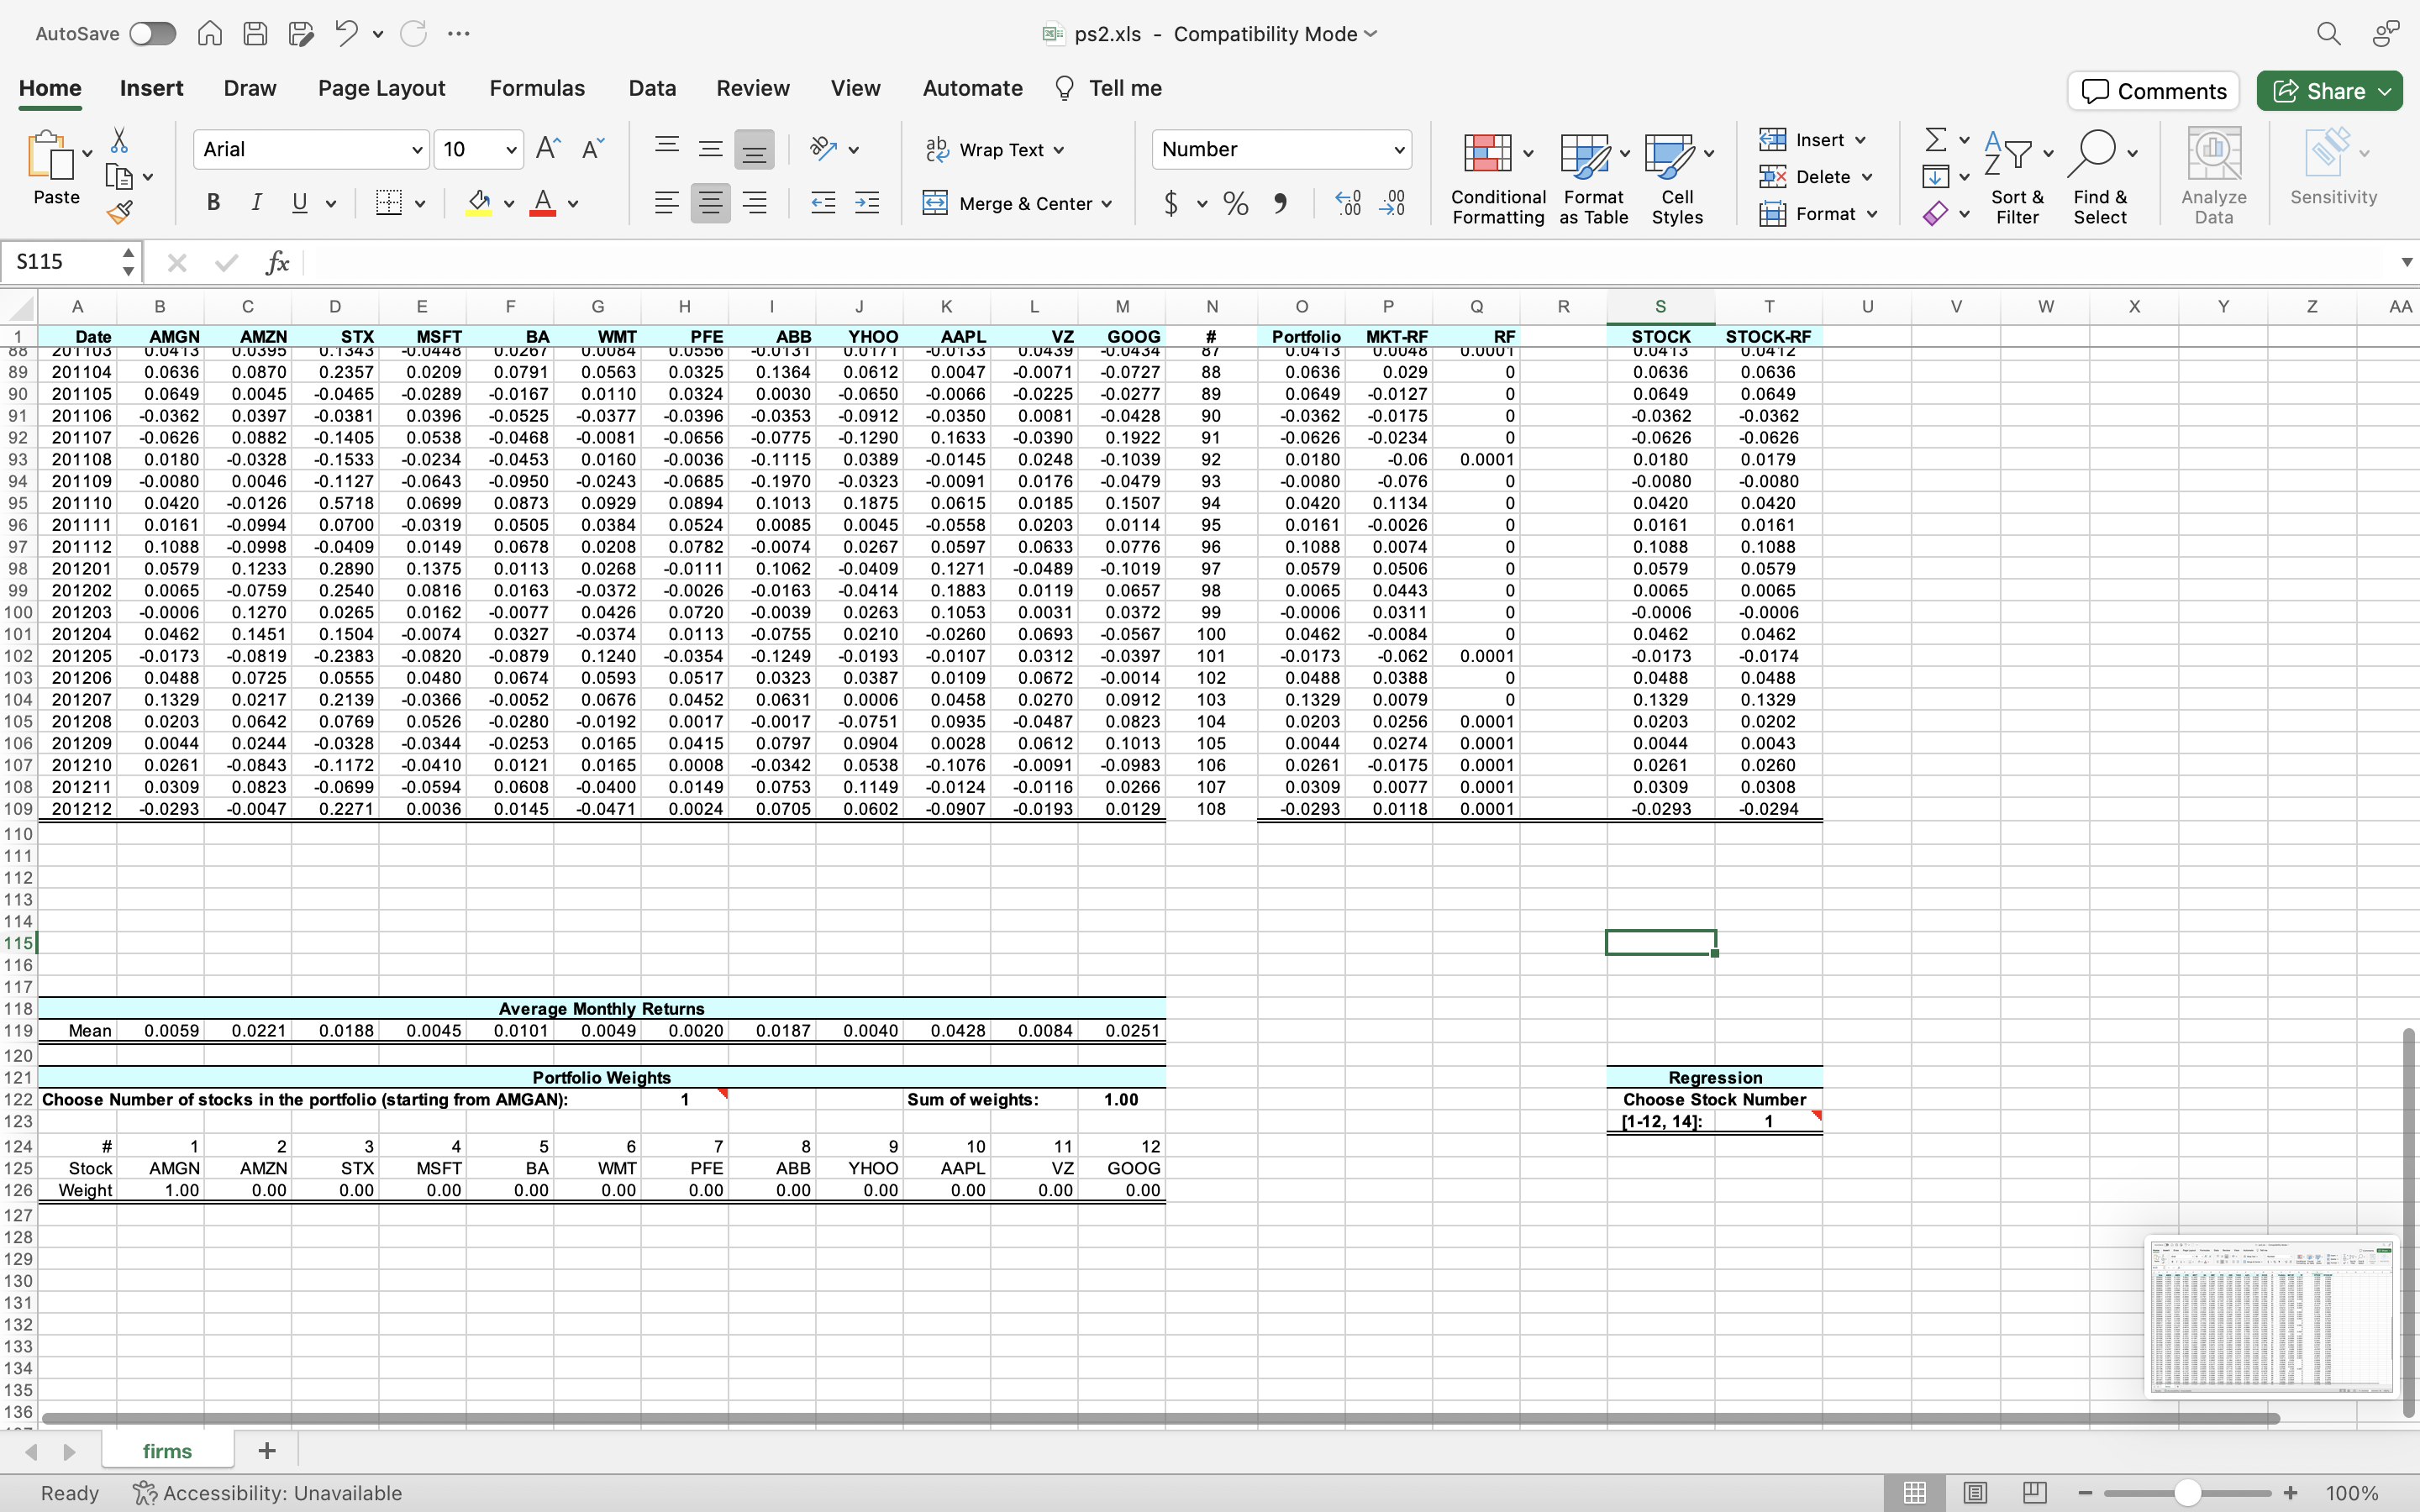
The file contains information about monthly returns of twelve stocks, AMGN, AMZN, STX MSFT BA
WMT PFE, ABB, YHOO, AAPL, VZ GOOG, as well as the valueweighted market index excess return
MKTRF and the riskfree rate RF The sample period begins on January and ends December
The spreadsheet is set in a way that you would only need to change the values in cells H and T in
order to control the portfolio weights and the stockportfolio chosen for the regression calculation.
a Calculate the Beta and
of each stock by running a regression of the monthly returns
of the stock excess of the riskfree rate on the monthly returns of the valueweighted market index
excess of the riskfree rate The latter are denoted MKTRF and they are located on Column P notice
the riskfree rate has already been subtracted from the index You can choose different stocks by
changing the values in cell T This would immediately provide you with the excess returns of each
stock in Column T These returns should be used for the regression.
b Graph a scattered plot of the Security Market Line SML ie each point on this plot is a pair of the
average returns of a stock and its Beta. Calculate the risk premium of the market index as the slope of the
regression line in this graph. Is the premium statistically significant? Are these results consistent with the
CAPM?
c Calculate the amount of idiosyncratic risk as a fraction of total risk
for five portfolios. The first
portfolio includes only AMGN. The second portfolio includes the first three stocks, ie AMGN, AMZN,
and STX Similarly, portfolios through include the first six, nine, and twelve stocks, respectively.
Page of
These portfolios can be chosen by changing the value of cell Hchange also the value of T to
to run the regressions for this part
d Plot the fraction of idiosyncratic risk as a function of the number of stocks in the portfolio. What is
your conclusion?
Step by Step Solution
There are 3 Steps involved in it
1 Expert Approved Answer
Step: 1 Unlock

Question Has Been Solved by an Expert!
Get step-by-step solutions from verified subject matter experts
Step: 2 Unlock
Step: 3 Unlock