

Question: For this graph plot the natural log of chlorine concentration as a function of time using the pooled time course data. Does the chlorine reaction
For this graph plot the natural log of chlorine concentration as a function of time using the pooled time course data. Does the chlorine reaction kinetics follow a first order process? What is the chlorine reaction rate constant? How does this rate constant compare to a first order decay distribution rate (kdistribution) in the system (kdistribution ~ 1/tresidence time; residence times in a distribution system can vary from about 0 to 7 days)? 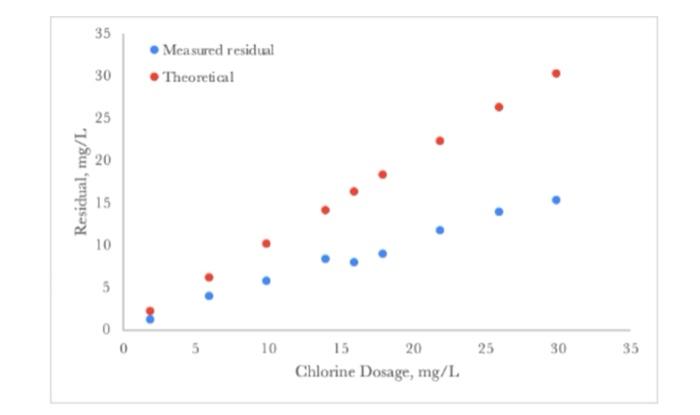
35 Measured residual Theoretical 30 25 20 Residual, mg/L 15 10 5 3 0 5 10 25 30 35 15 20 Chlorine Dosage, mg/L
Step by Step Solution
There are 3 Steps involved in it
1 Expert Approved Answer
Step: 1 Unlock

Question Has Been Solved by an Expert!
Get step-by-step solutions from verified subject matter experts
Step: 2 Unlock
Step: 3 Unlock