

Question: For this homework we will replicate and extend the results in the World Happiness Report. We will use the data in the Excel file called

For this homework we will replicate and extend the results in the World Happiness Report. We will use the data in the Excel file called "World happiness report data for homework EDITED"
You can review material in week 6 PPT and Clark's book on Estimation issues.
At the end of the file there is info on how to run regressions in Excel.
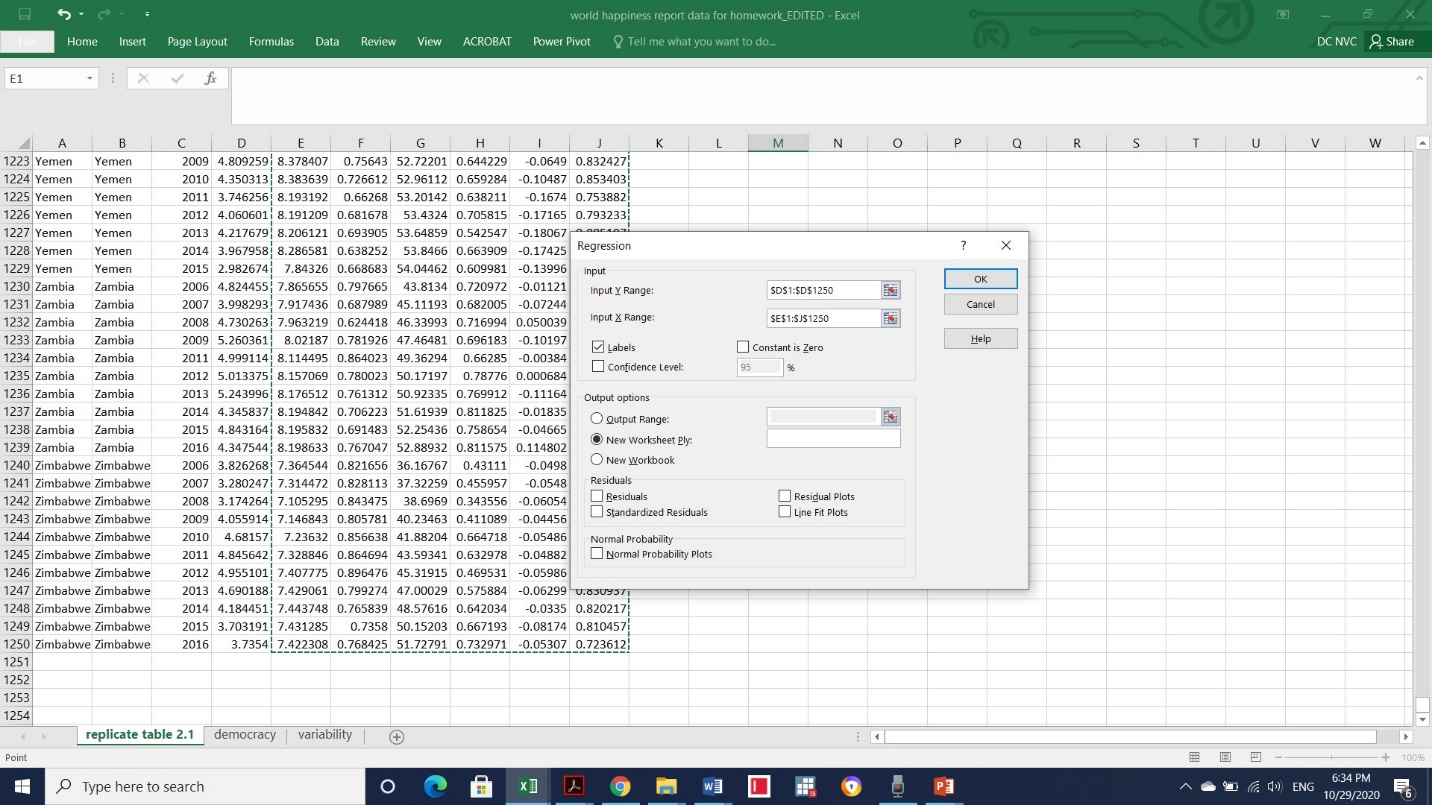
- We will start by reproducing Table 2.1 from the World Happiness Report 2017 (see the table at the end of this file). Choose the sheet in Excel file called replicate Table 2.1. Open Data/Analysis tab and Regression menu (see instructions below). Select the ranges for Y and X variables (same that used in Table 2.1). Produce regression results and Copy them into your Homework file. Compare the results with those reported in Table 2.1. The results you generate should be quite close.
- What do you think could be the reasons for the differences (between your results and the ones reported in the table 2.1)?
- (Hint: look at all the rows in the table, what is missing in your regression? also, read carefully the table 2.1 and footnote to the table in the WHR).
- We will now add another variable - democracy. Open sheet called Democracy and select all the relevant variables (i.e. same 6 as in Table 2.1 PLUS democracy). Copy your results into your homework file. What do you find? (Is democracy statistically significant?)
- Run the same regression as in item 2 but do not include log GDP per capita. What do you find? (Is democracy statistically significant?) Why do you think the results change?
- Now open the sheet called variability. Run the regression that includes the standard deviation of ladder by country-year but does not include social support. (see WHR 2017 https://worldhappiness.report/ed/2017/for discussion of this variable on page 34 in section called "how does inequality affects the social foundations of happiness"). What does this variable measure? Describe your results.
REMINDER: Keep tracking your weekly happiness level that will be due Homework #8 (see instructions in Homework #1).
** How to Run Regressions in Excel.
- Install Data Analysis toolpack. Go to File-Options-Add-ins and choose Analysis toolpack.
- For older Excel versions see instructions here http://www.wikihow.com/Run-a-Multiple-Regression-in-Excel
- Open Data tab, find Data Analysis tab and open it. Find Regression tab.
- Open the regression tab (see link above for instructions). Enter cell range for Life Ladder as a Y variable and select all the remaining columns (after Life Ladder) as range for X variable. Check the "labels" box and click OK. This should generate regression results in a new sheet. (notice the output option section to see where the program will place your regression results)

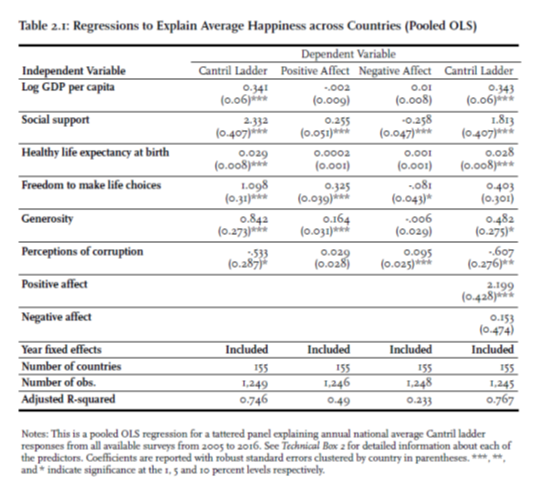
world happiness report data for homework_EDITED - Excel Home Insert Page Layout Formulas Data Review View ACROBAT Power Pivot ? Tell me what you want to do.. DC NVC & Share E1 X V A B C D E F G H K M N O P Q R S T U V W 1223 Yemen Yemen 2009 4.809259 8.378407 0.75643 52.72201 0.644229 -0.0649 0.832427 1224 Yemen Yemen 2010 4.350313 8.383639 0.726612 52.96112 0.659284 -0.10487 0.853403 1225 Yemen Yemen 2011 3.746256 8.193192 0.66268 53.20142 0.638211 -0.1674 0.753882 1226 Yemen Yemen 2012 4.060601 8.191209 0.681678 53.4324 0.705815 -0.17165 0.793233; 1227 Yemen Yemen 2013 4.217679 8.206121 0.693905 53.64859 0.542547 -0.18067 1228 Yemen Yemen 2014 3.967958 8.286581 0.638252 53.8466 0.663909 -0.17425 Regression ? X 1229 Yemen Yemen 2015 2.982674 7.84326 0.668683 54.04462 0.609981 -0.13996 Input OK 1230 Zambia Zambia 2006 4.824455; 7.865655 0.797665 43.8134 0.720972 -0.01121 Input Y Range: SD$1:$D$1250 1231 Zambia Zambia 2007 3.998293 7.917436 0.687989 45.11193 0.682005 -0.07244 Cancel 1232 Zambia Zambia 2008 4.730263 7.963219 0.624418 46.33993 0.716994 0.050039 Input X Range: SE$1:SJS1250 1233 Zambia Zambia 2009 5.260361 8.02187 0.781926 47.46481 0.696183 -0.10197 Help Labels Constant is Zero 1234 Zambia Zambia 2011 4.999114 8.114495 0.864023 49.36294 0.66285 -0.00384 Confidence Level: 95 1235 Zambia Zambia 2012 5.013375 8.157069 0.780023 50.17197 0.78776 0.000684 1236 Zambia Zambia 2013 5.243996 8.176512 0.761312 50.92335 0.769912 -0.11164 Output options 1237 Zambia Zambia 2014 4.345837 8.194842 0.706223 51.61939 0.811825 -0.01835 O Output Range: 1238 Zambia Zambia 2015 4.843164 8.195832 0.691483 52.25436 0.758654 -0.04665 1239 Zambia 2016 4.347544 8.198633 0.767047 52.88932 0.811575 0.114802 New Worksheet Ply: Zambia 1240 Zimbabwe Zimbabwe 2006 3.826268 7.364544 0.821656 36.16767 0.43111 -0.0498 New Workbook 1241 Zimbabwe Zimbabwe 2007 3.280247 7.314472 0.828113 37.32259 0.455957 -0.0548 Residuals 1242 Zimbabwe Zimbabwe 2008 3.174264 7.105295 0.843475 38.6969 0.343556 -0.06054 Residuals Residual Plots 1243 Zimbabwe Zimbabwe 2009 4.055914 7.146843 0.805781 40.23463 0.411089 -0.04456 Standardized Residuals Line Fit Plots 1244 Zimbabwe Zimbabwe 2010 4.68157 7.23632 0.856638 41.88204 0.664718 -0.05486 Normal Probability 1245 Zimbabwe Zimbabwe 2011 4.845642 7.328846 0.864694 43.59341 0.632978 -0.04882 Normal Probability Plots 1246 Zimbabwe Zimbabwe 2012 4.955101 7.407775 0.896476 45.31915 0.469531 -0.05986 1247 Zimbabwe Zimbabwe 2013 4.690188 7.429061 0.799274 47.00029 0.575884 -0.06299 0.63095/ 1248 Zimbabwe Zimbabwe 2014 4.184451 7.443748 0.765839 48.57616 0.642034 -0.0335 0.820217 1249 Zimbabwe Zimbabwe 2015 3.703191 7.431285 0.7358 50.15203 0.667193 -0.08174 0.810457 1250 Zimbabwe Zimbabwe 2016 3.7354 7.422308 0.768425 51.72791 0.732971 -0.05307 0.723612; 1251 1252 1253 1254 replicate table 2.1 democracy variability + Point B J -- + Type here to search x 1 7 9 W O P3 A 6 2 )ENG 6:34 PM 10/29/2020Table 2.1: Regressions to Explain Average Happiness across Countries (Pooled OLS) Dependent Variable Independent Variable Cantril Ladder Positive Affect Negative Affect Cantril Ladder Log GDP per capita 0.341 ..002 0.01 0.143 (0.06)# (0.09) (0.008) (0.06)+ Social support 2.132 0.255 -0.258 1.813 (0.407)#i (0.051)thi (0.047)+ (0.407)+ Healthy life expectancy at birth 0.029 0.0002 0.001 0.028 (0.008)+ (0.001) (0.001) (0.008)+ Freedom to make life choices 1098 0.325 0.403 (0.31) (0.ojg)tik (0.043)# (0.301) Generosity 0.842 0.164 -.006 0.482 (0.273) (0.029) (0.275)* Perceptions of corruption -:533 0.029 0.095 -.607 (0.287) (0.028) (0.276)* Positive affect 2.199 (0.428)+ Negative affect 0.15 (0-474) Year fixed effects Included Included Included Included Number of countries 155 155 155 155 Number of obs. 1.249 1,246 1,248 1,245 Adjusted R-squared 0.746 0.49 0.233 0.767 Notes: This is a pooled OLS regression for a tattered panel explaining annual national average Cantril Ladder responses from all available surveys from zoo5 to 2016. See Technical Box a for detailed information about each of the predictors. Coefficients are reported with robust standard errors clustered by country in parentheses, the, #, and * indicate significance at the 1, 5 and to percent levels respectively
Step by Step Solution
There are 3 Steps involved in it

Get step-by-step solutions from verified subject matter experts