

Question: For this homework we will replicate and extend the results in the World Happiness Report. We will use the data in the Excel file called
For this homework we will replicate and extend the results in the World Happiness Report. We will use the data in the Excel file called "World happiness report data for homework EDITED"
You can review material in week 6 PPT and Clark's book on Estimation issues.
At the end of the file there is info on how to run regressions in Excel.
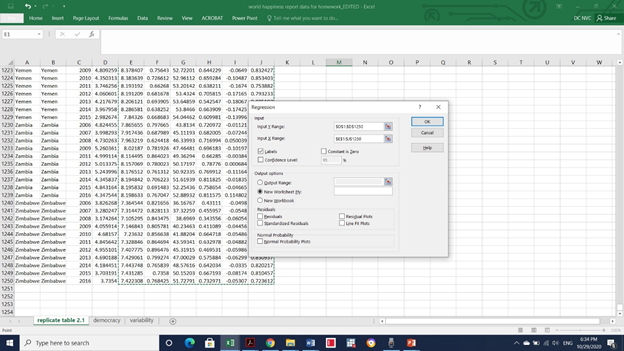
- We will start by reproducing Table 2.1 from the World Happiness Report 2017 (see the table at the end of this file). Choose the sheet in Excel file called replicate Table 2.1. Open Data/Analysis tab and Regression menu (see instructions below). Select the ranges for Y and X variables (same that used in Table 2.1). Produce regression results and Copy them into your Homework file. Compare the results with those reported in Table 2.1. The results you generate should be quite close.
- What do you think could be the reasons for the differences (between your results and the ones reported in the table 2.1)?
- (Hint: look at all the rows in the table, what is missing in your regression? also, read carefully the table 2.1 and footnote to the table in the WHR).
- We will now add another variable - democracy. Open sheet called Democracy and select all the relevant variables (i.e. same 6 as in Table 2.1 PLUS democracy). Copy your results into your homework file. What do you find? (Is democracy statistically significant?)
- Run the same regression as in item 2 but do not include log GDP per capita. What do you find? (Is democracy statistically significant?) Why do you think the results change?
- Now open the sheet called variability. Run the regression that includes the standard deviation of ladder by country-year but does not include social support. (see WHR 2017 https://worldhappiness.report/ed/2017/for discussion of this variable on page 34 in section called "how does inequality affects the social foundations of happiness"). What does this variable measure? Describe your results.
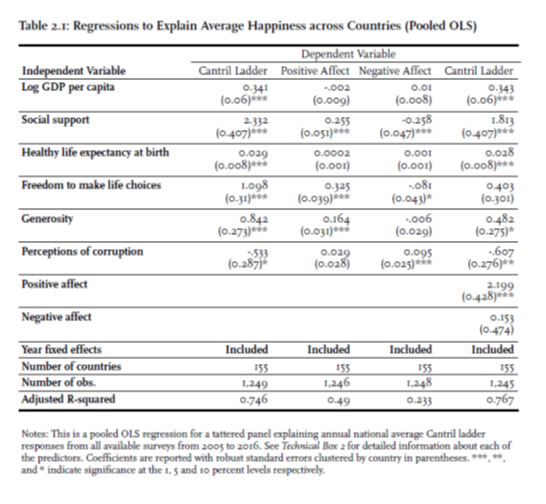
\fTable 2.1: Regressions to Explain Average Happiness across Countries (Pooled OLS) Dependent Variable Independent Variable Cantril Ladder Positive Affect Negative Affect Cantril Ladder Log GDP per capita 0.341 ..002 0.01 0.143 (0.06)# (0.09) (0.008) (0.06)+ Social support 2.132 0.255 -0.258 1.813 (0.407)#i (0.051)thi (0.047)+ (0.407)+ Healthy life expectancy at birth 0.029 0.0002 0.001 0.028 (0.008)+ (0.001) (0.001) (0.008)+ Freedom to make life choices 1098 0.325 0.403 (0.31) (0.ojg)tik (0.043)# (0.301) Generosity 0.842 0.164 -.006 0.482 (0.273) (0.029) (0.275)* Perceptions of corruption -:533 0.029 0.095 -.607 (0.287) (0.028) (0.276)* Positive affect 2.199 (0.428)+ Negative affect 0.15 (0-474) Year fixed effects Included Included Included Included Number of countries 155 155 155 155 Number of obs. 1.249 1,246 1,248 1,245 Adjusted R-squared 0.746 0.49 0.233 0.767 Notes: This is a pooled OLS regression for a tattered panel explaining annual national average Cantril Ladder responses from all available surveys from zoo5 to 2016. See Technical Box a for detailed information about each of the predictors. Coefficients are reported with robust standard errors clustered by country in parentheses, the, #, and * indicate significance at the 1, 5 and to percent levels respectively
Step by Step Solution
There are 3 Steps involved in it

Get step-by-step solutions from verified subject matter experts