

Question: For this nominal and interval data, which graphical methods should be chosen (for example, line, bar chart, run chart)? Why is this the best option?
For this nominal and interval data, which graphical methods should be chosen (for example, line, bar chart, run chart)? Why is this the best option? (Please provide reference and bibliographical information)
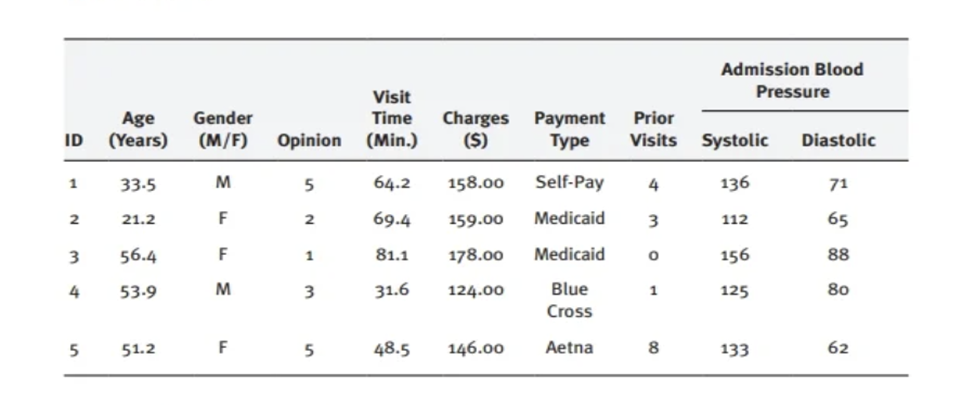
ID 1 2 3 4 5 Age (Years) 33-5 21.2 56.4 53.9 51.2 Gender (M/F) M F F M F Opinion 5 2 1 3 5 Visit Time (Min.) 64.2 158.00 69.4 159.00 81.1 178.00 124.00 31.6 Charges Payment Prior ($) 48.5 146.00 Type Visits Systolic Diastolic Self-Pay 4 Medicaid 3 Medicaid Blue Cross Aetna 0 1 Admission Blood Pressure 8 136 112 156 125 133 71 65 88 80 62
Step by Step Solution
There are 3 Steps involved in it
1 For the given problem the graphical methods that should be chosen are line charts and bar chart... View full answer

Get step-by-step solutions from verified subject matter experts