

Question: For this problem, my task is simple. I have to be able to summarize what key concepts are being explained in the example. I

For this problem, my task is simple. I have to be able to "summarize what key concepts are being explained in the example. I have to summarize what the problem is explaining and the bottom-line concepts described in the problem."
Can you help me summarize what this problem is stating and be able to explain it in basic English? Thank you.

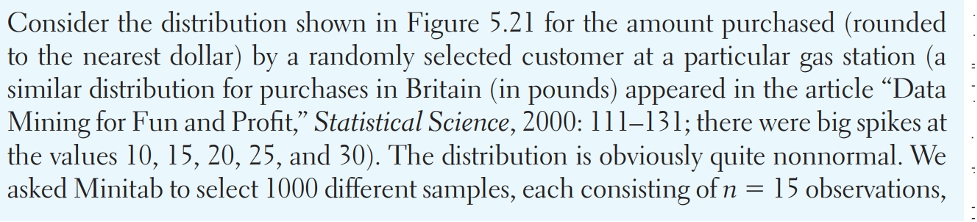
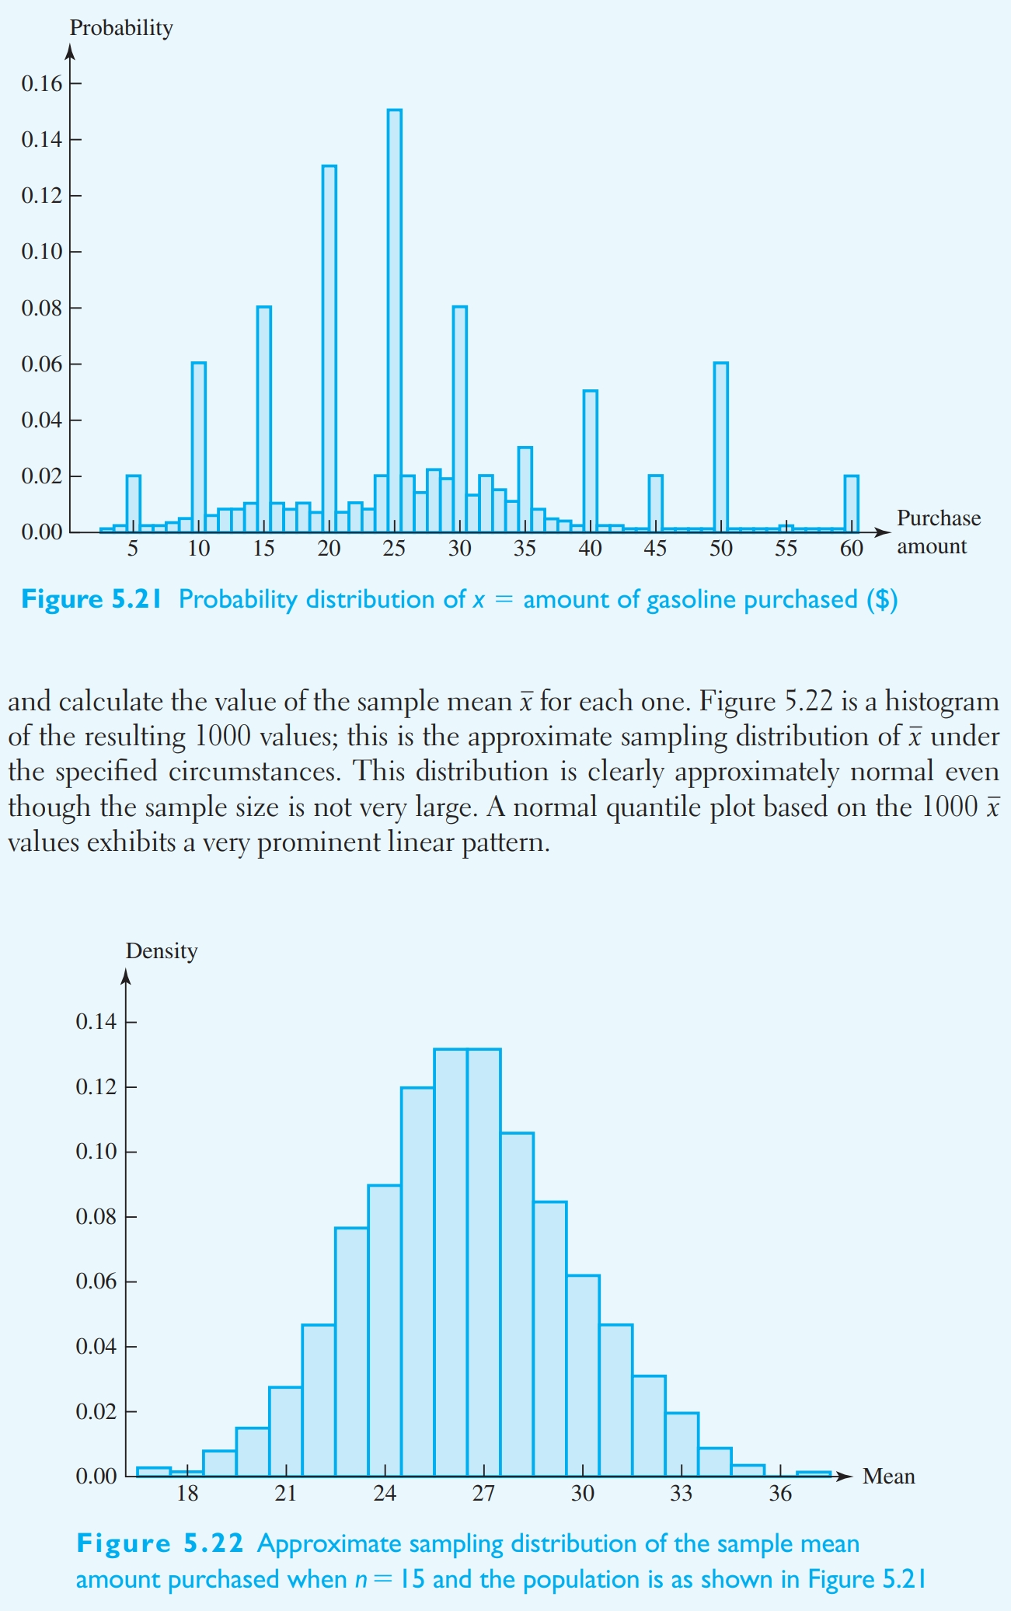
Probability 0.16 0.14 0.12 0.10 0.08 0.06 0.04 0.02 0.00 Purchase 5 10 15 20 25 30 35 40 45 50 55 60 amount Figure 5.21 Probability distribution of x = amount of gasoline purchased ($) and calculate the value of the sample mean x for each one. Figure 5.22 is a histogram of the resulting 1000 values; this is the approximate sampling distribution of x under the specified circumstances. This distribution is clearly approximately normal even though the sample size is not very large. A normal quantile plot based on the 1000 x values exhibits a very prominent linear pattern. Density 0.14 0.12 0.10 0.08 0.06 0.04 0.02 0.00 Mean 18 21 24 27 30 33 36 Figure 5.22 Approximate sampling distribution of the sample mean amount purchased when n = 15 and the population is as shown in Figure 5.21Consider the distribution shown in Figure 5.21 for the amount purchased (rounded to the nearest dollar) by a randomly selected customer at a particular gas station (a similar distribution for purchases in Britain (in pounds) appeared in the article \"Data j Mining for Fun and Prot,\" Statistical Science, 2000: 111131; there were big spikes at ' the values 10, 15, 20, 25, and 30). The distribution is obviously quite nonnorrnal. We asked Minitab to select 1000 different samples, each consisting ofn = 15 observations
Step by Step Solution
There are 3 Steps involved in it

Get step-by-step solutions from verified subject matter experts