

Question: for this project, you will use the provided financial statements for Starbucks. Take 2019 and 2020 information given and perform the required financial radio is
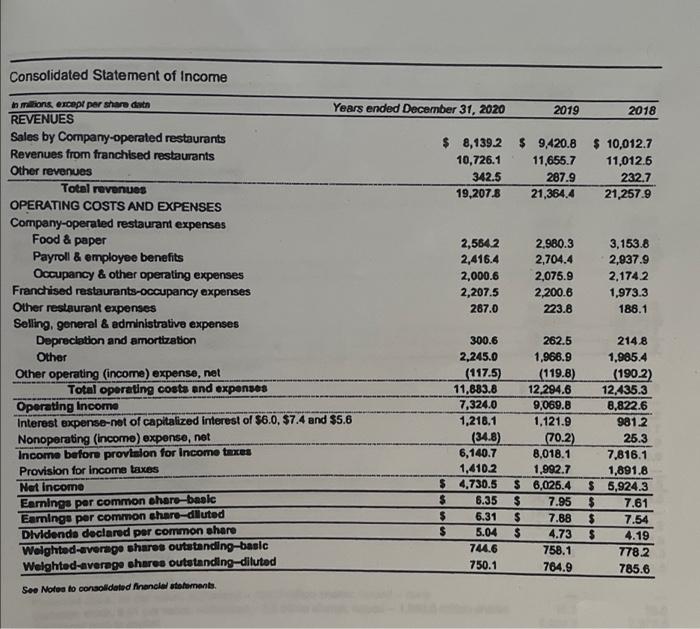
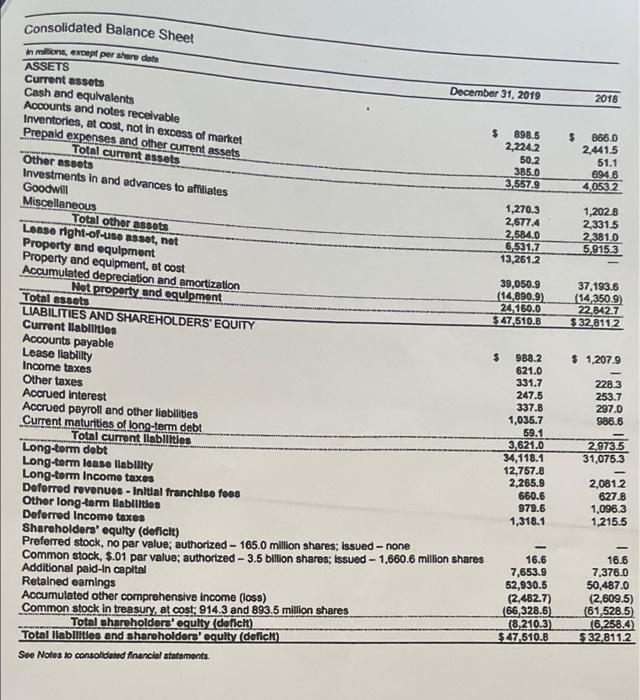
Consolidated Statement of Income in milions except par share data Years ended December 31, 2020 2019 2018 REVENUES Sales by Company-operated restaurants $ 8,139.2 $ 9,420.8 $ 10,012.7 Revenues from franchised restaurants 10,726.1 11,655.7 11,012.6 Other revenues 342.5 287.9 232.7 Total revenues 19,2078 21,364.4 21,257.9 OPERATING COSTS AND EXPENSES Company-operated restaurant expenses Food & paper 2,564.2 2.980.3 3,153.8 Payroll & employee benefits 2,416.4 2,704.4 2,937.9 Occupancy & other operating expenses 2,000.6 2,075.9 2,1742 Franchised restaurants occupancy expenses 2,207.5 2,200.6 1.973.3 Other restaurant expenses 287.0 223.8 186.1 Selling, general & administrative expenses Depreciation and amortization 300.6 262.5 214.8 Other 2,245.0 1,966.9 1.985.4 Other operating (income) expense, net (117.5) (119.8) (1902) Total operating costs and expenses 11.883.8 12.294.6 12.435.3 Operating Income 7,324.0 9,069.8 8,822.6 Interest expense-net of capitalized interest of $6.0, $7.4 and $5.6 1,218.1 1.121.9 981.2 Nonoperating (incomo) expense, net (34.8) (70.2) 25.3 Income before provision for Income taxes 6,140.7 8.018.1 7,816.1 Provision for income taxes 1,410-2 1,992.7 1,891.8 Net Income $ 4,730.5 $ 6,025.4 $ 5,924.3 $ 6.35 $ Earnings por common share basic 7.95 $ 7.61 $ Earnings per common share-diluted 6.31 $ 7.88 $ 7.54 $ Dividenda declared per common share 5.04 $ 4.73 $ 4.19 Wolghted average shares outstanding-basic 744.6 758.1 7782 Weighted average shares outstanding-diluted 750.1 764.9 785.6 See Note to consolidated financial statements Consolidated Balance Sheet in million, except per shendete ASSETS Current assets December 31, 2019 2018 Cash and equivalents Accounts and notes receivable Inventories, at cost, not in excess of market $ 898.5 $ 866.0 Prepaid expenses and other current assets 2,2242 2.441.5 Total current assets 50.2 51.1 Other assets 385.0 6946 Investments in and advances to affiliates 3 557,9 4,0532 Goodwill Miscellaneous 1,270.3 1,2028 2,677.4 2.331.5 Total other assets 2.584.0 2,381.0 Lensa right-of-use asset, net 6,531.7 5.915.3 Property and equipment 13,261.2 Property and equipment, at cost Accumulated depreciation and amortization 39,050.9 37.193.6 Not property and equipment (14,890.9) (14 350.9 Total 83.sete 24.160.0 22,842.7 LIABILITIES AND SHAREHOLDERS' EQUITY $ 47,510.B $32.8112 Current llabilities Accounts payable $ 938.2 $ 1,2079 Lease liability 621.0 Income taxes 331.7 228.3 Other taxes 247.5 253.7 Accrued Interest 337.8 297.0 Accrued payroll and other liabilities 1,035.7 988.6 Current maturities of long-term debt 59.1 Total current llabilities 3.621.0 2.973.5 Long-term debt 34,118.1 31,075.3 Long-term lease liability 12,757.8 Long-term Income taxes 2,265.9 2,0812 Deferred revenues - Initial franchise foes 660.6 627.8 979.6 1,096.3 Other long-term labilities Deferred Income taxes 1,318.1 1.215.5 Shareholders' equlty (deficit) Preferred stock, no par value; authorized - 165.0 million shares; Issued - none 16.6 16.6 Common stock, $.01 par value; authorized - 3.5 billon shares; issued 1,660.6 million shares 7,653.9 7,376.0 Additional pald-in capital 52,930.5 50,487.0 Retained earnings (2,482.7) (2,609.5) Accumulated other comprehensive income (loss) (66,328.6) (61,528.5) Common stock in treasury, at cost: 914.3 and 893.5 million shares (8210.3) 16.258.4 Total shareholders' equlty (doficit) 5.47 510.B 5328112 Total Habilities and shareholders' equity (delicht) See Notes to consolidated financial statements
Step by Step Solution
There are 3 Steps involved in it

Get step-by-step solutions from verified subject matter experts