

Question: For this question i only need part B done The historical returns for two investmentsA and Bare summarized in the following table for the period
For this question i only need part B done 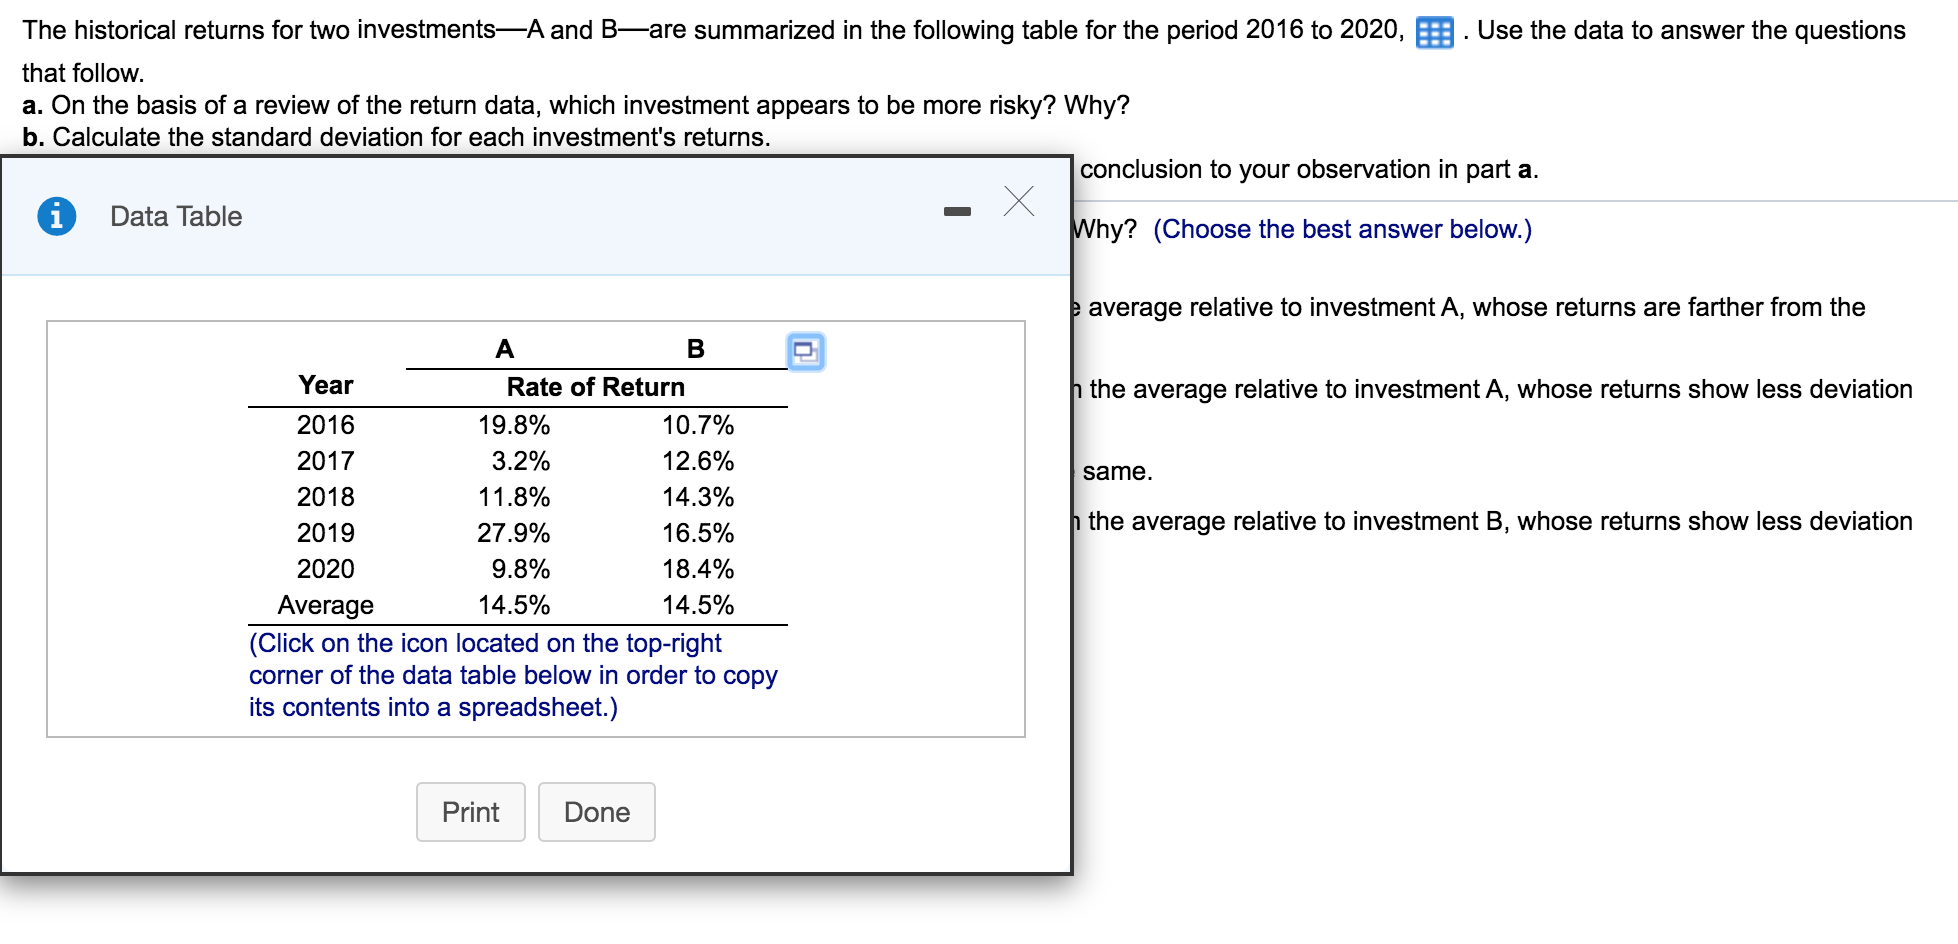
The historical returns for two investmentsA and Bare summarized in the following table for the period 2016 to 2020, Use the data to answer the questions that follow. a. On the basis of a review of the return data, which investment appears to be more risky? Why? b. Calculate the standard deviation for each investment's returns. conclusion to your observation in part a. i Data Table Why? (Choose the best answer below.) average relative to investment A, whose returns are farther from the h the average relative to investment A, whose returns show less deviation same. A B Year Rate of Return 2016 19.8% 10.7% 2017 3.2% 12.6% 2018 11.8% 14.3% 2019 27.9% 16.5% 2020 9.8% 18.4% Average 14.5% 14.5% (Click on the icon located on the top-right corner of the data table below in order to copy its contents into a spreadsheet.) h the average relative to investment B, whose returns show less deviation Print Done
Step by Step Solution
There are 3 Steps involved in it

Get step-by-step solutions from verified subject matter experts