

Question: The historical returns for two investmentsA and Bare summarized in the following table for the period 2016 to 2020, Use the data to answer the
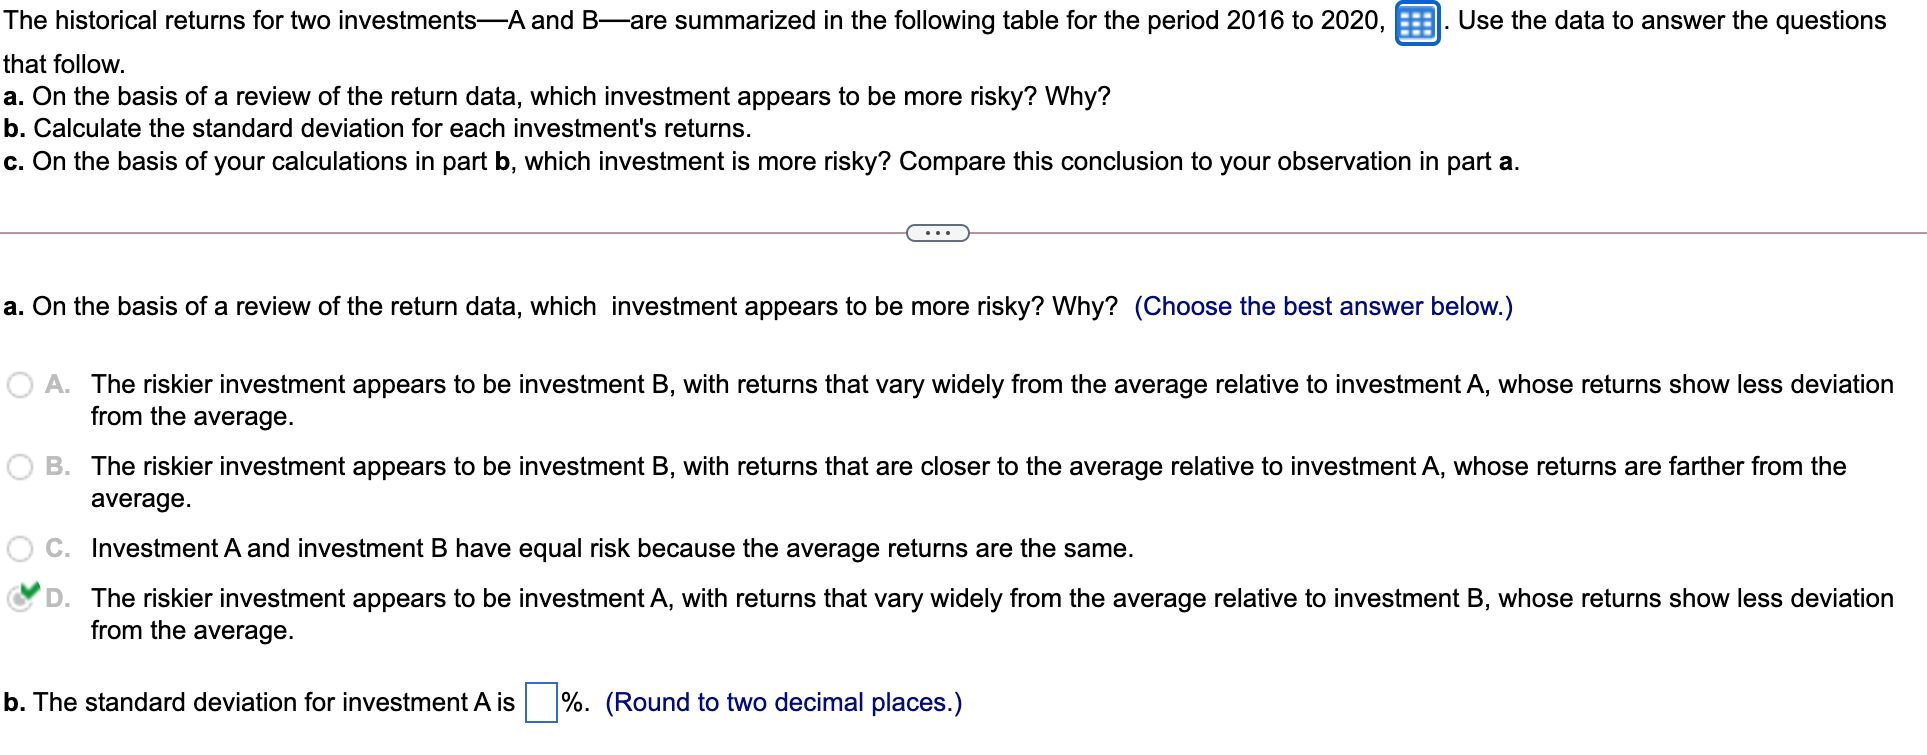
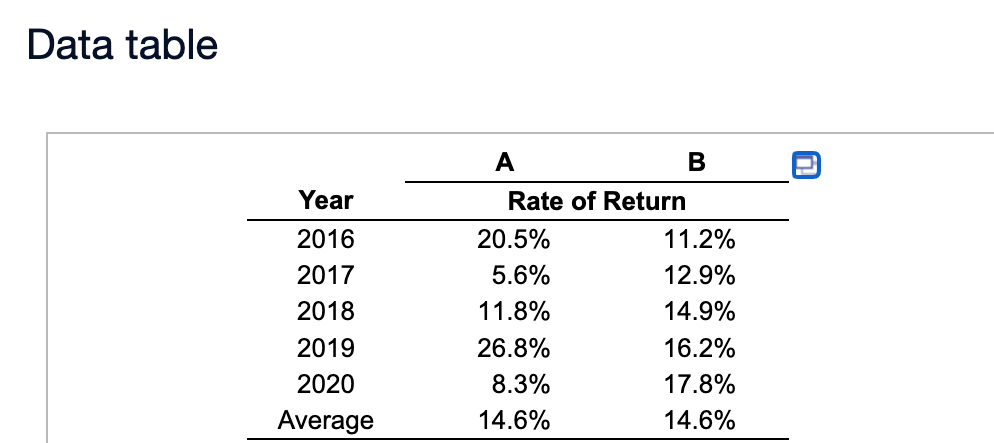
The historical returns for two investmentsA and Bare summarized in the following table for the period 2016 to 2020, Use the data to answer the questions that follow. a. On the basis of a review of the return data, which investment appears to be more risky? Why? b. Calculate the standard deviation for each investment's returns. c. On the basis of your calculations in part b, which investment is more risky? Compare this conclusion to your observation in part a. a. On the basis of a review of the return data, which investment appears to be more risky? Why? (Choose the best answer below.) A. The riskier investment appears to be investment B, with returns that vary widely from the average relative to investment A, whose returns show less deviation from the average. B. The riskier investment appears to be investment B, with returns that are closer to the average relative to investment A, whose returns are farther from the average. C. Investment A and investment B have equal risk because the average returns are the same. D. The riskier investment appears to be investment A, with returns that vary widely from the average relative to investment B, whose returns show less deviation from the average. b. The standard deviation for investment A is %. (Round to two decimal places.) Data table A B Year 2016 2017 2018 2019 2020 Average Rate of Return 20.5% 11.2% 5.6% 12.9% 11.8% 14.9% 26.8% 16.2% 8.3% 17.8% 14.6% 14.6%
Step by Step Solution
There are 3 Steps involved in it

Get step-by-step solutions from verified subject matter experts