

Question: For this question, I've done this graph below. I just want to write time of 24 hours, Can you please tell me how I can

For this question, I've done this graph below.
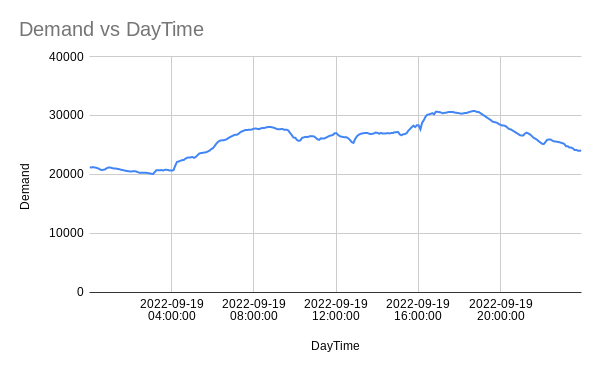
I just want to write time of 24 hours, Can you please tell me how I can do that. I've done this graph on EXCEL . Also, if you find any mistake in this graph please make me aware of it. Thank you
3) Produce a chart showing how the demand for electrical POWER changed over 24Hrs with an x-axis that shows the time (in Hours), Modify your axis labels so text is bold \& at least font 12 [ 10 points] Demand vs DayTime 40000 DayTime
Step by Step Solution
There are 3 Steps involved in it
1 Expert Approved Answer
Step: 1 Unlock

Question Has Been Solved by an Expert!
Get step-by-step solutions from verified subject matter experts
Step: 2 Unlock
Step: 3 Unlock