

Question: For this workshop we will be using Google?s merchandise store as our analytics website. This is because Google provides free demo usage of Google Analytics
For this workshop we will be using Google?s merchandise store as our analytics website. This is because Google provides free demo usage of Google Analytics on this particular website. Using an example where a website has to be setup would be much more time consuming, with little benefit in regards to the focus of what is being taught. The Google Merchandise store can be found in the link below (you should briefly familiarise yourself with the website so you can better understand the analytics):
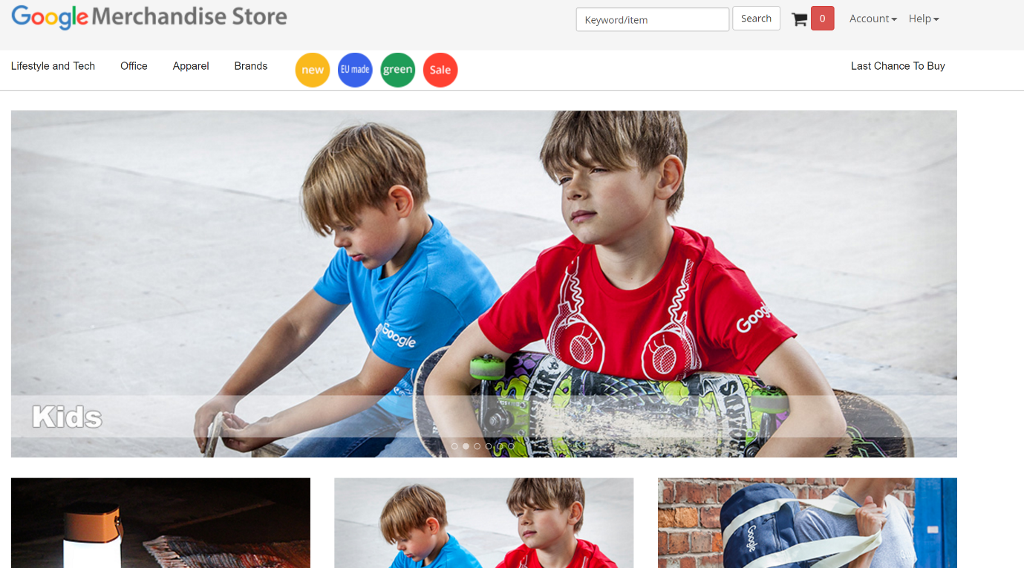
Figure 1: Google Merchandise Store (https://www.googlemerchandisestore.com/)
Getting Started
In order to start this workshop, you will need access to your own Google account (which most people would have from using either, or both, an Android Device/Youtube). If you do not have a Google account then create one, just for this workshop.
First up you will need to navigate to the following link to access Google?s demo account:
https://support.google.com/analytics/answer/6367342?hl=en
Next you will need to scroll down the webpage and find a hyperlink which will let you access the demo account:
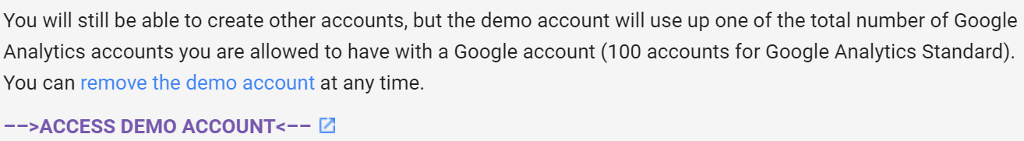
Figure 2: Accessing the demo account
Once you have clicked this hyperlink and followed the details Google will ask for and you should come to the following page:
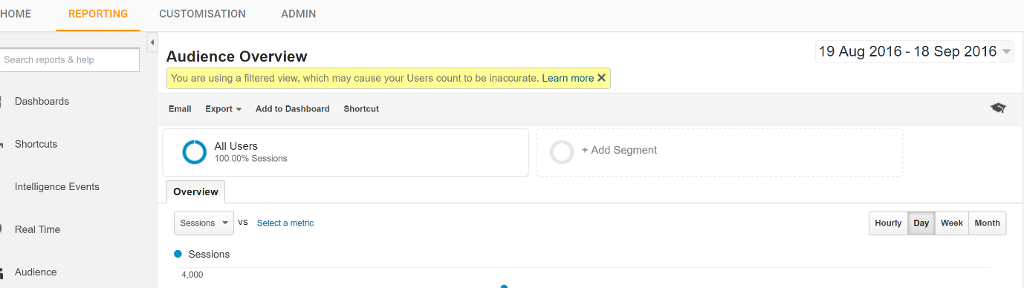
Figure 3: The first page inside of Google Analytics demo
Analysing Audiences
While we looked into Demographics of those who have visited the Google Merchandise store.
From the previous workshop we were limited on how far Excel let us drill into each of our demographic groups (e.g. what was the purchasing patterns of people in a particular age group?). With Google Analytics we will be able to drill deeper into our choice of demographic group. On the left hand side, select ?Audience, then, under ?Interests? select ?Affinity? Categories. When you come to a new page, scroll down and you will see the most common affinity categories that come to the Google merchandise store:
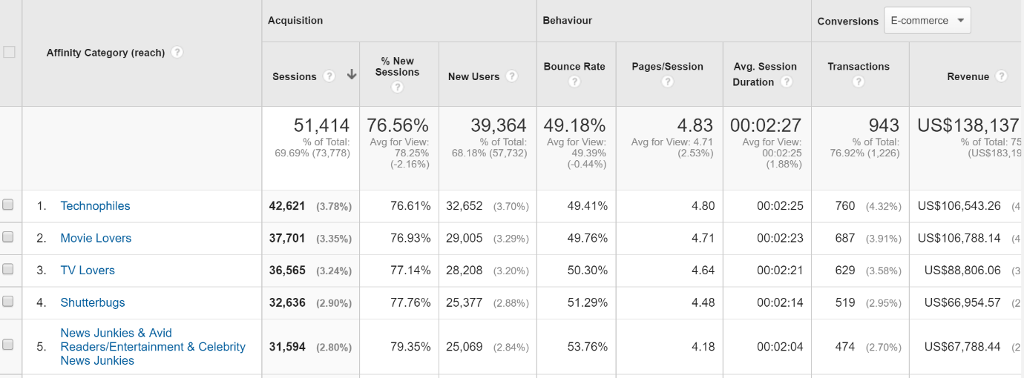
Figure 4: Statistics for Affinity Categories
These categories are decided from interests that particular demographics have, established from Google Analytics cookies tracing users on other websites. You can think of affinity categories as the combination of demographic information with interest categories. There is a fair bit of complexity in this to make it necessary to explain inside of this workshop, but if you are interested in this for your reflection the following link will be of interest to you:
https://support.google.com/adsense/answer/2839090?hl=en
If you look into the columns we can see different statistics for the affinity category, with the sessions being the number that has made the filter.
The benefit of these categories is that we can drill into them. Select a category that you would like to drill into find more about. Next you will see a deeper breakdown of this demographic by their age:
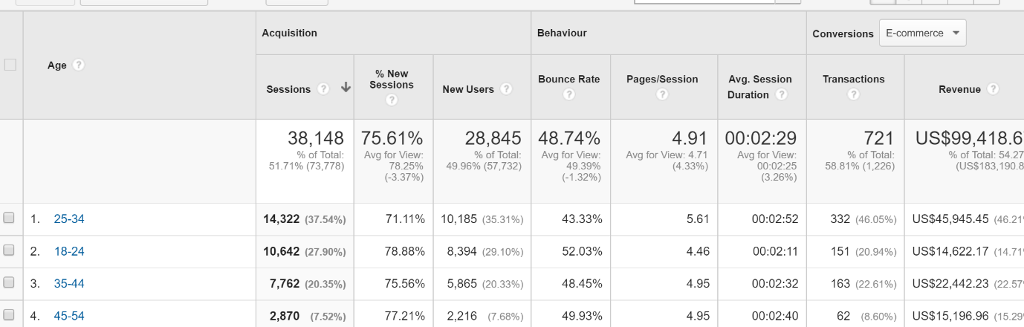
Figure 5: Second level of affinity categories
You will see a range of columns with different terms (as would be found in the affinity category section). The statistics show the following:
Sessions: A period of time that a user is actively engaged with your website. This includes all active usage data, such as screen views, events and ecommerce.
% New Sessions: An estimate of the percentage of first time users (Look at the highest percentage, is this what you would expect of a merchandise store for a technology company?)
New Users: The number of first time users during this date range.
Bounce Rate: The number of people who have left your website without interacting with it (Again, do you see a theme in demographics?)
Page/Session: The average number of pages viewed in a session (Do you see any demographic that is far below, or well above, other demographics?)
Avg. Session Duration: The average length of a session.
Transactions: The number of completed purchases on your website
Revenue: The total revenue from web e-commerce transactions.
Ecommerce Conversion: The percentage of sessions that resulted in an e-commerce transaction.
Next, drill into the next demographic that you find interesting (this is your choice, interesting does not have to mean the most significant demographic). You should now see the final level, where these demographics have been broken down by their gender:
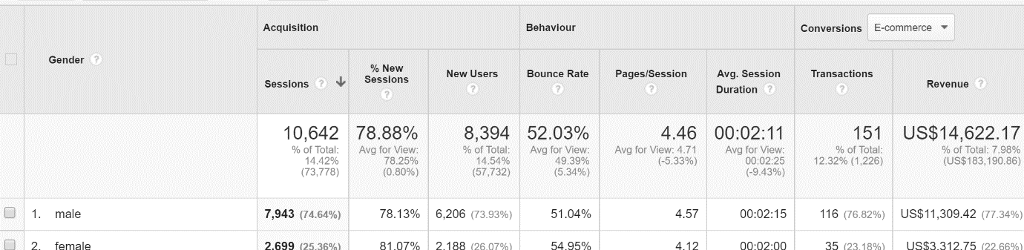
Figure 6: Third level of affinity categories
From here you can interpret the analytics again, such as whether you see any significant differences in any of the columns, between the two demographics.
Behaviour
Staying under the ?Audience tab?, click on the sub-menu for ?Behaviour?. Once you have selected this you will see three options:
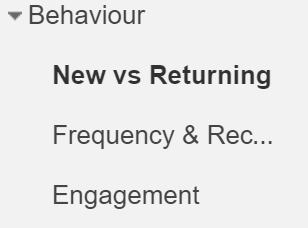
Figure 7: Sub-menus for Behaviour
Click on the first section, ?New vs Returning?.
New vs Returning
Here we will be able to see users that are coming to the Google Merchandise store for the first time, versus having visited at least once before. Scroll down to the analytics.:
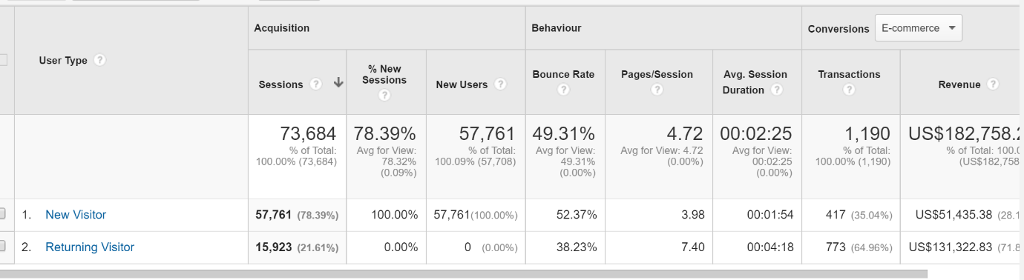
Figure 8: Analytics for ?New? versus ?Returning? Google Analytics Visitors
You will recognise that analytics are broken down into the same categories as before. As such, we can drill down into one of the two categories to find out about these users, though Google does not break this down any further, unfortunately, so clicking on them will only reduce them to the same statistics, less the other option (e.g. click on ?New Visitor? and all that Google Analytics will do is remove ?Returning Visitor?).
However, we can go to a different view on this data. Above the data, under ?Explorer?, select ?Site Usage?:
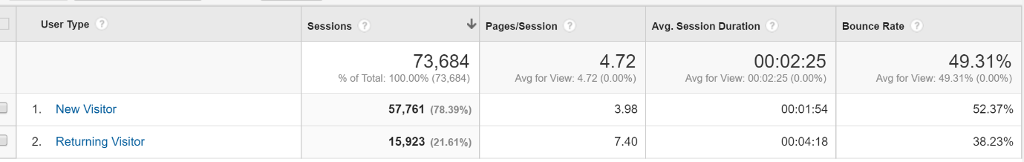
Figure 9: Site Usage Statistics Screen
While you cannot breakdown the new and returning visitor, as with the Summary tab, here you should be able to interpret a significant difference in usage statistics between the two types of visitors.
Frequency & Recency
Click onto the next tab below ?New vs Returning?, Frequency & Recency, where we will be able to see a breakdown of how many users visit the website on one, or more, occasions:
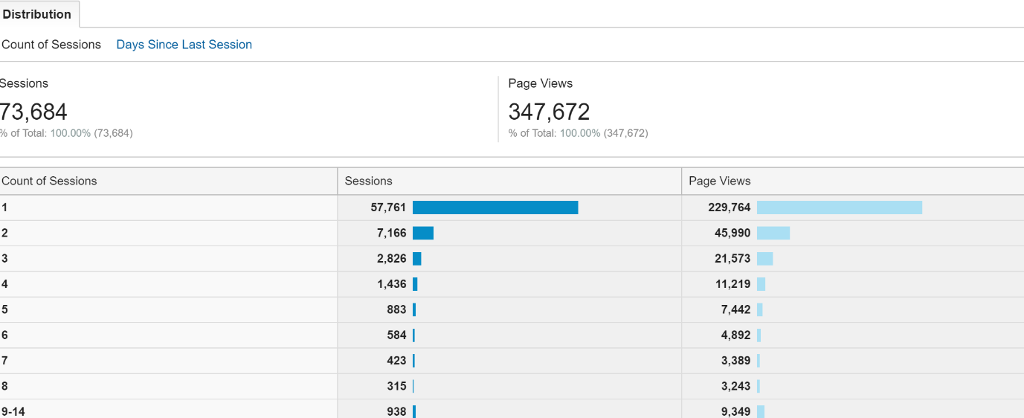
Figure 10: Count of Sessions for visitors
You will notice that your ?Count of Sessions? for 1 will be the same number as your ?New Visitors on the previous tab. You will also see that the number of sessions declines, but increases in some higher number sessions. Above this data, under ?Distribution?, you will be able to see ?Days Since Last Session?. Click into this option:
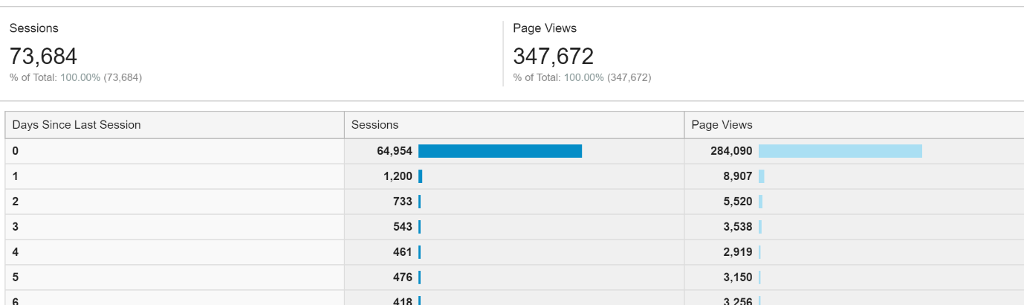
Figure 11: Days Since Last Session for Visitors
Here you will be able to see the last time that a user visited the website before returning again in days.
Engagement
Click onto the final tab for the ?Behaviour? sub-category, ?Engagement?. The first part of distribution, ?Session Duration? will give you an insight on how long users are staying on the website for:
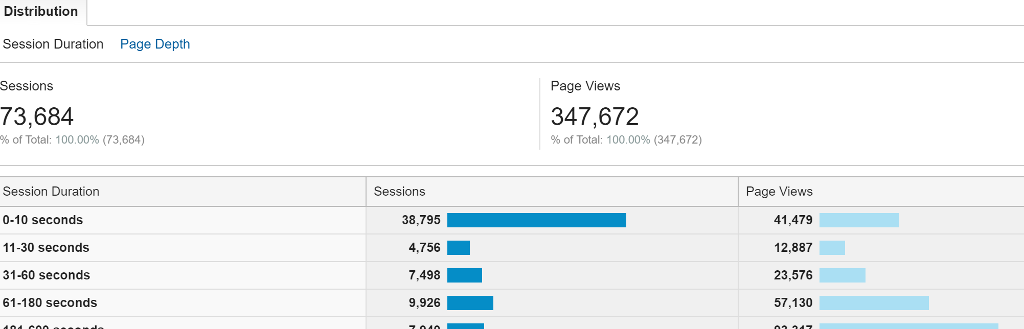
Figure 12: Session Duration Statistics
Click onto the next menu for distribution, ?Page Depth?. Here you will be able to see how many pages users go to in their session:
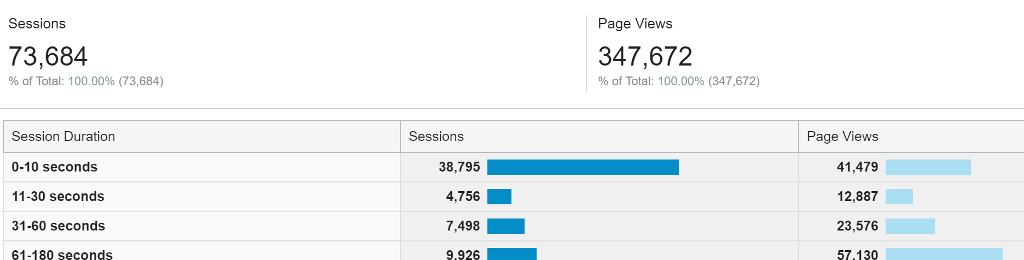
Figure 13: Page Depth Statistics
Creating your Dashboard
At the top of the left hand Reporting menu you will see the dashboard option:

Figure 14: Dashboard Button
Click into dashboards, select ?+ New Dashboard?. The following will pop-up:
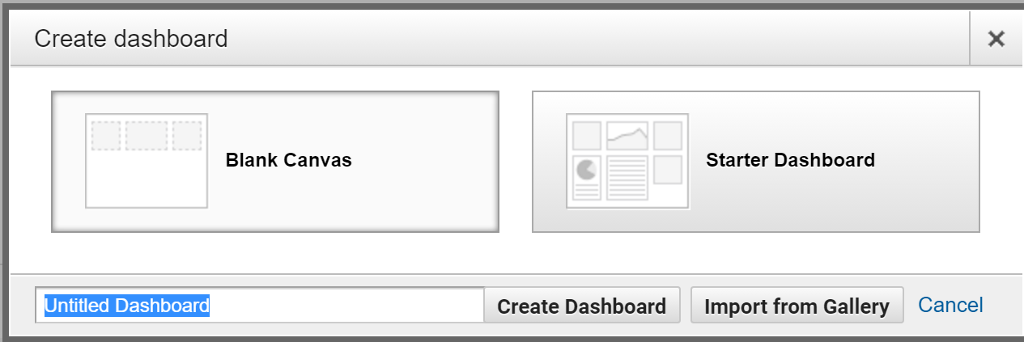
Figure 15: Creating a Dashboard
Select ?Blank Canvas? and select a name of your choice (if you are not sure, just enter your name followed by ?dashboard? e.g. ?Rory?s Dashboard?). You will now have the option of adding widgets:
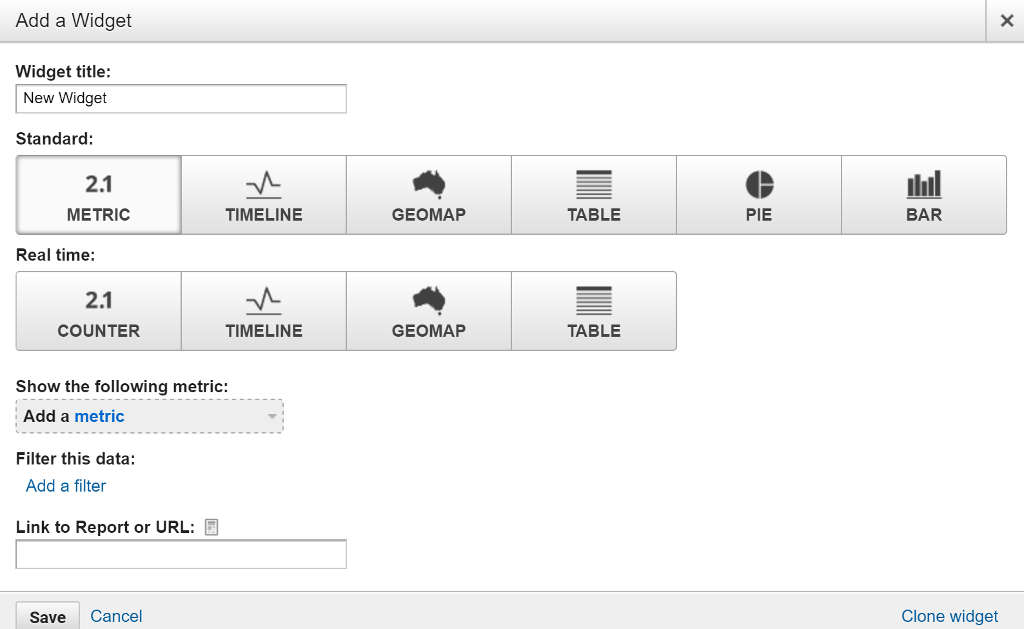
Figure 16: Adding of Widgets
For this example we will create a Geomap. Click onto ?GEOMAP? under standard and the following option should appear below:
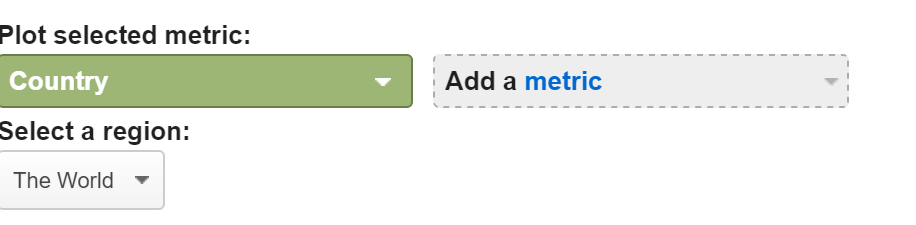
Figure 17: Geomap metric selections
For ?Plot Selected Metric? select ?City?. Under ?Add a metric? select ?Sessions?. Under ?Select a Region? type in ?New Zealand?. After you have done this click ?Save?. You should now have a map on your dashboard which shows how many sessions have occurred on the Google Merchandise Store website in a date range (in the top right hand corner):
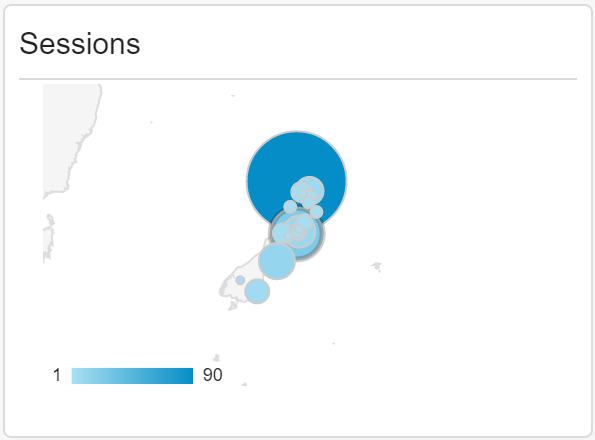
Figure 18: Widget of Sessions in New Zealand
Task 1: Add 2 more widgets to your dashboard. Briefly explain what value that these widgets offer. (2 Marks) (Submit with screenshots)
Task 2: Create a reflection of 250 words (this is a limit, not a target) on an area of interest you found inside of the data in Google Analytics. (3 Marks)
This is up to you how you want to interpret this, but you should look into the data, such as looking at:
What is the limitations of Google Analytics (with evidence)?
A difference between two demographic groups.
The value of these analytics for decision making.
You should include proof (in the form of a screenshot) if you are making specific reference to data.
You will be marked as follows:
1 Mark: A reflection has been made, though little insight into the analytics is shown. The reflection is more of a summary of the analytics than a reflection: very little personal insight. The insights integrate very little, if any, evidence.
2 Marks: The reflection has demonstrated a good amount of reflection, integrating evidence from Google Analytics with some personal reflection. The reflection shows some evidence of learning Google Analytics concept. The reflection has included some evidence.
3 Marks: The reflection shows deep, personal, insights with well-integrated evidence from Google Analytics. This evidence add substance to the personal reflection. The reflection shows some learning beyond what has been covered in the workshop.
Those figure are not important, just answer task1 and task2
Google Merchandise Store Lifestyle and Tech Office Apparel Brands Kids new EU made green Sale Google Keyword/item Search Googl FROARDS 0 Account Help U Last Chance To Buy You will still be able to create other accounts, but the demo account will use up one of the total number of Google Analytics accounts you are allowed to have with a Google account (100 accounts for Google Analytics Standard). You can remove the demo account at any time. -->ACCESS DEMO ACCOUNT HOME Search reports & help Dashboards Shortcuts REPORTING Intelligence Events Real Time Audience CUSTOMISATION Audience Overview You are using a filtered view, which may cause your Users count to be inaccurate. Learn more X Email Export Add to Dashboard ADMIN Overview All Users 100.00% Sessions Sessions Vs Select a metric Sessions 4,000 Shortcut + Add Segment 19 Aug 2016 - 18 Sep 2016 - Hourly Day Week Month Affinity Category (reach) ? 1. Technophiles 2. Movie Lovers 3. TV Lovers 4. Shutterbugs 5. News Junkies & Avid Readers/Entertainment & Celebrity News Junkies Acquisition Sessions ? 51,414 % of Total: 69.69% (73,778) 42.621 (3.78%) 37,701 (3.35%) 36,565 (3.24%) 32,636 (2.90%) 31,594 (2.80%) % New Sessions 76.56% Avg for View: 78.25% (-2.16%) New Users ? % of Total: 68.18% (57,732) 39,364 49.18% Avg for View: 49.39% (-0.44%) 76.61% 32,652 (3.70%) 76.93% 29,005 (3.29 %) 77.14% 28,208 (3.20%) 77.76% 25,377 (2.88%) Behaviour 79.35% 25,069 (2.84%) Bounce Rate 49.41% 49.76% 50.30% 51.29% 53.76% Pages/Session 4.83 00:02:27 Avg for View: 00:02:25 (1.88%) Avg for View: 4.71 (2.53%) 4.80 4.71 4.64 4.48 Avg. Session Duration ? 4.18 00:02:25 00:02:23 00:02:21 00:02:14 00:02:04 Conversions E-commerce Transactions 943 US$138,137 % of Total: 75 (US$183,19 % of Total: 76.92% (1,226) 760 (4.32%) 687 (3.91%) 629 (3.58%) 519 (2.95%) Revenue? 474 (2.70%) US$106,543.26 (4 US$106,788.14 (4) US$88,806.06 (3 US$66,954.57 (2) US$67,788.44 (2) Age ? 1. 25-34 2. 18-24 3. 35-44 3. 4. 45-54 4. Acquisition Sessions ? 38,148 75.61% Avg for View: 78.25% (-3.37%) % of Total: 51.71% (73,778) 14,322 (37.54%) 10,642 (27.90%) 7,762 (20.35%) % New Sessions 2,870 (7.52%) 78.88% 75.56% New Users ? 71.11% 10,185 (35.31%) 77.21% % of Total: 49.96% (57,732) 28,845 48.74% 8,394 (29.10%) 5,865 (20.33%) Behaviour 2,216 (7.68 %) Bounce Rate ? Avg for View: 49.39% (-1.32%) 43.33% 52.03% 48.45% 49.93% Pages/Session ? 4.91 00:02:29 Avg for View: 00:02:25 (3.26%) Avg for View: 4.71 (4.33%) 5.61 4.46 4.95 Avg. Session Duration ? 4.95 00:02:52 00:02:11 00:02:32 00:02:40 Conversions E-commerce Transactions ? 721 US$99,418.6 % of Total: 54.27 (US$183,190.8 % of Total: 58.81% (1,226) Revenue ? 332 (46.05 %) 151 (20.94%) 163 (22.61%) 62 (8.60%) US$45,945.45 (46.21 US$14,622.17 (14.715 US$22,442.23 (22.57 US$15,196.96 (15.29 Gender 7 1. male n 2. female Acquisition Sessions 10,642 78.88% Avg for View: % of Total: 14.42% 78.25% (73,778) (0.80%) 7,943 (74.64%) % New Sessions 2.699 (25.36%) 78.13% 81.07% New Users ? % of Total: 14.54% (57,732) 8,394 52.03% Avg for View: 49.39% (5.34%) 6,206 (73.93 %) Behaviour 2.188 (26.07%) Bounce Rate 51.04% 54.95% Pages/Session 4.46 00:02:11 Avg for View: 00:02:25 (-9.43%) Avg for View: 4.71 (-5.33%) 4.57 Avg. Session Duration ? 4.12 00:02:15 00:02:00 Conversions E-commerce Transactions 151 US$14,622.17 % of Total: 7.98 % (US$183,190,86) % of Total: 12.32% (1,226) Revenue ? 116 (76.82%) US$11,309.42 (77.34%) 35 (23.18%) US$3.312.75 (22.66% Behaviour New vs Returning Frequency & Rec... Engagement D User Type ? 1. New Visitor 2. Returning Visitor Acquisition Sessions ? 73,684 78.39% Avg for View: 78.32% (0.09%) % of Total: 100.00% (73,684) 57,761 (78.39%) % New Sessions 15,923 (21.61%) New Users ? 0.00% % of Total: 100.09% (57,708) 100.00% 57,761(100.00%) 57,761 49.31% Avg for View: 49.31% (0.00%) Behaviour 0 (0.00%) Bounce Rate 52.37% 38.23% Pages/Session 4.72 00:02:25 Avg for View: 00:02:25 (0.00%) Avg for View: 4.72 (0.00%) 3.98 Avg. Session Duration ? 7.40 00:01:54 00:04:18 Conversions E-commerce Transactions 1,190 US$182,758.: % of Total: 100.0 (US$182,758 % of Total: 100.00% (1,190) 417 (35.04%) Revenue ? 773 (64.96%) US$51,435.38 (28.1) US$131,322.83 (71.8) D User Type ? 1. New Visitor 2. Returning Visitor Sessions ? 73,684 % of Total: 100.00 % ( 73,684) 57,761 (78.39%) 15,923 (21.61%) Pages/Session ? 4.72 Avg for View: 4.72 (0.00%) 3.98 7.40 Avg. Session Duration ? 00:02:25 Avg for View: 00:02:25 (0.00%) 00:01:54 00:04:18 Bounce Rate ? 49.31% Avg for View: 49.31% (0.00%) 52.37% 38.23% Distribution Count of Sessions Days Since Last Session Sessions 73,684 of Total: 100.00% (73,684) Count of Sessions 1 2 3 4 5 6 7 8 9-14 Sessions 57,761 7,166 2,826 1,436 883 584 423 315 938 Page Views 347,672 % of Total: 100.00% (347,672) Page Views 229,764 45,990 21,573 11,219 7,442 4,892 3,389 3,243 9,349 Sessions 73,684 % of Total: 100.00% ( 73,684) Days Since Last Session 0 1 2 3 4 5 Sessions 64,954 1,200 | 733 | 543 | 461 | 476 | 418 I Page Views 347,672 % of Total: 100.00% (347,672) Page Views 284,090 8,907 5,520 3,538 2,919 3,150 3 256 Distribution Session Duration Page Depth Sessions 73,684 % of Total: 100.00% (73,684) Session Duration 0-10 seconds 11-30 seconds 31-60 seconds 61-180 seconds 404 C00 Sessions 38,795 4.756 7,498 9,926 7.040 Page Views 347,672 % of Total: 100.00% (347,672) Page Views 41,479 12,887 23,576 57,130 02 247 Sessions 73,684 % of Total: 100.00% (73,684) Session Duration 0-10 seconds 11-30 seconds 31-60 seconds 61-180 seconds Sessions 38,795 4,756 7,498 9.926 Page Views 347,672 % of Total: 100.00% (347,672) Page Views 41,479 12,887 23,576 57.130 Dashboards Create dashboard Untitled Dashboard Blank Canvas Create Dashboard Starter Dashboard Import from Gallery Cancel X Add a Widget Widget title: New Widget Standard: 2.1 METRIC Real time: 2.1 COUNTER Filter this data: Add a filter Show the following metric: Add a metric Link to Report or URL: TIMELINE Save Cancel TIMELINE GEOMAP GEOMAP TABLE TABLE PIE BAR X Clone widget Plot selected metric: Country Select a region: The World Add a metric Sessions 1 90
Step by Step Solution
3.42 Rating (146 Votes )
There are 3 Steps involved in it

Get step-by-step solutions from verified subject matter experts