

Question: For those data points; x : 1 . 2 , 1 . 5 , 2 . 0 , 2 . 1 , 2 . 7
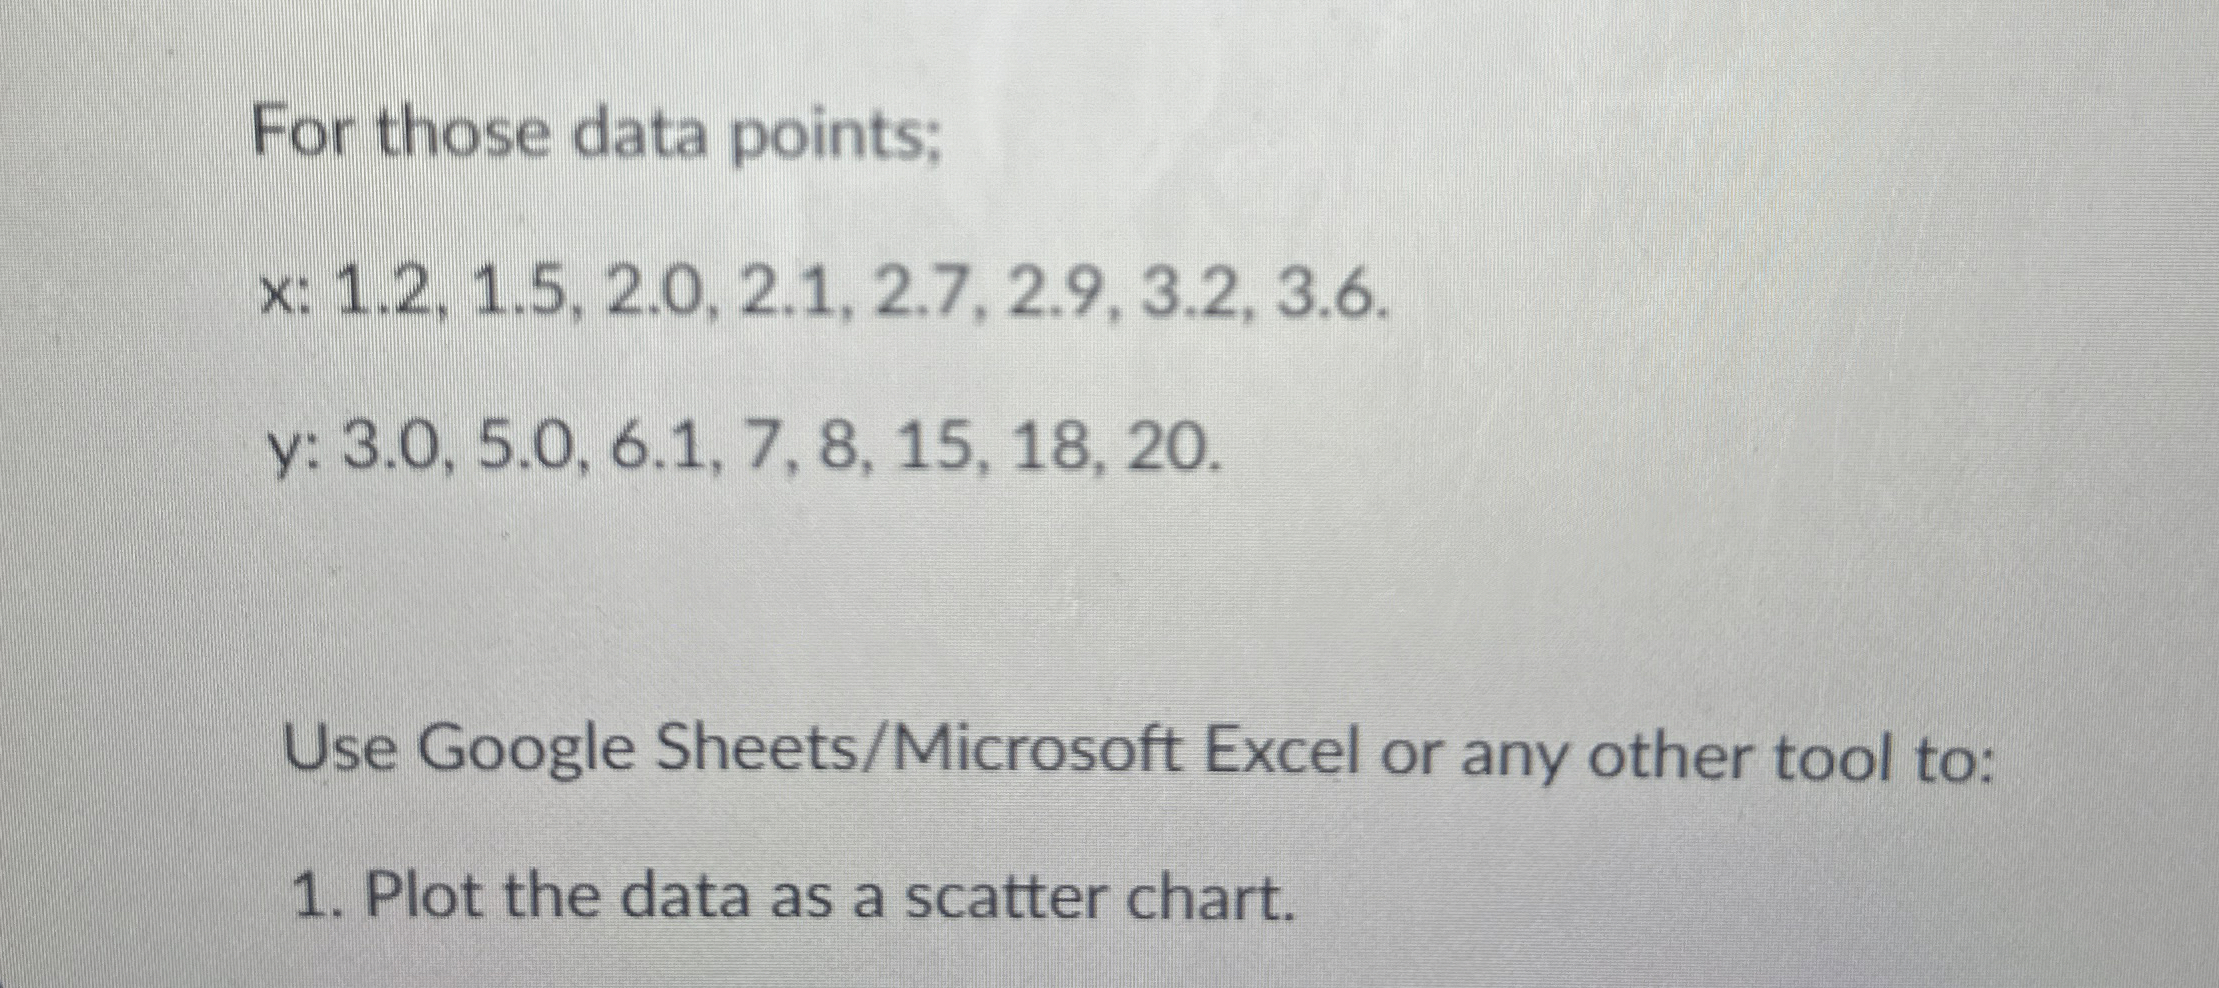
For those data points;
:
:
Use Google SheetsMicrosoft Excel or any other tool to:
Plot the data as a scatter chart.
Step by Step Solution
There are 3 Steps involved in it
1 Expert Approved Answer
Step: 1 Unlock

Question Has Been Solved by an Expert!
Get step-by-step solutions from verified subject matter experts
Step: 2 Unlock
Step: 3 Unlock