

Question: For Xbar - Charts and R - Charts, a process is in control if: the R - Chart shows the Mean is in control the
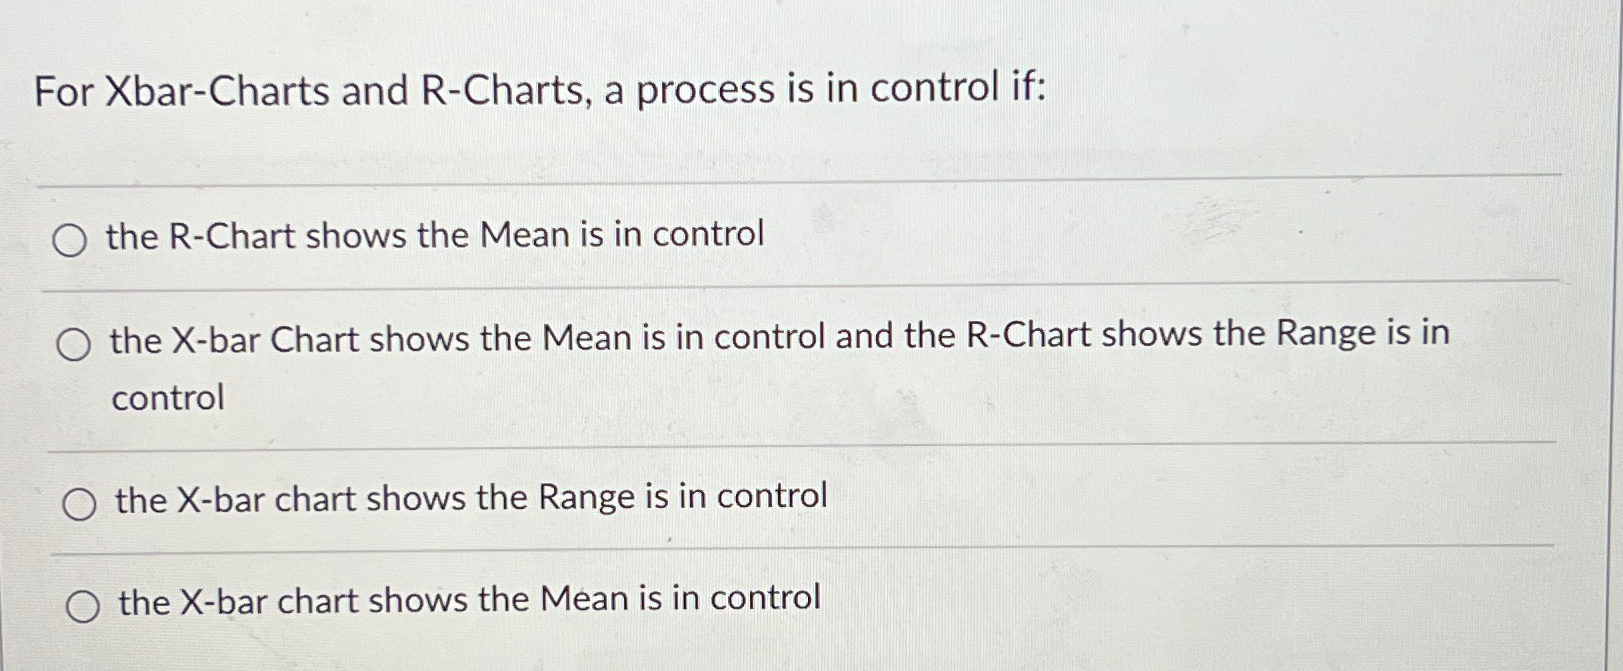
For XbarCharts and RCharts, a process is in control if:
the RChart shows the Mean is in control
the Xbar Chart shows the Mean is in control and the RChart shows the Range is in control
the Xbar chart shows the Range is in control
the Xbar chart shows the Mean is in control
Step by Step Solution
There are 3 Steps involved in it
1 Expert Approved Answer
Step: 1 Unlock

Question Has Been Solved by an Expert!
Get step-by-step solutions from verified subject matter experts
Step: 2 Unlock
Step: 3 Unlock