

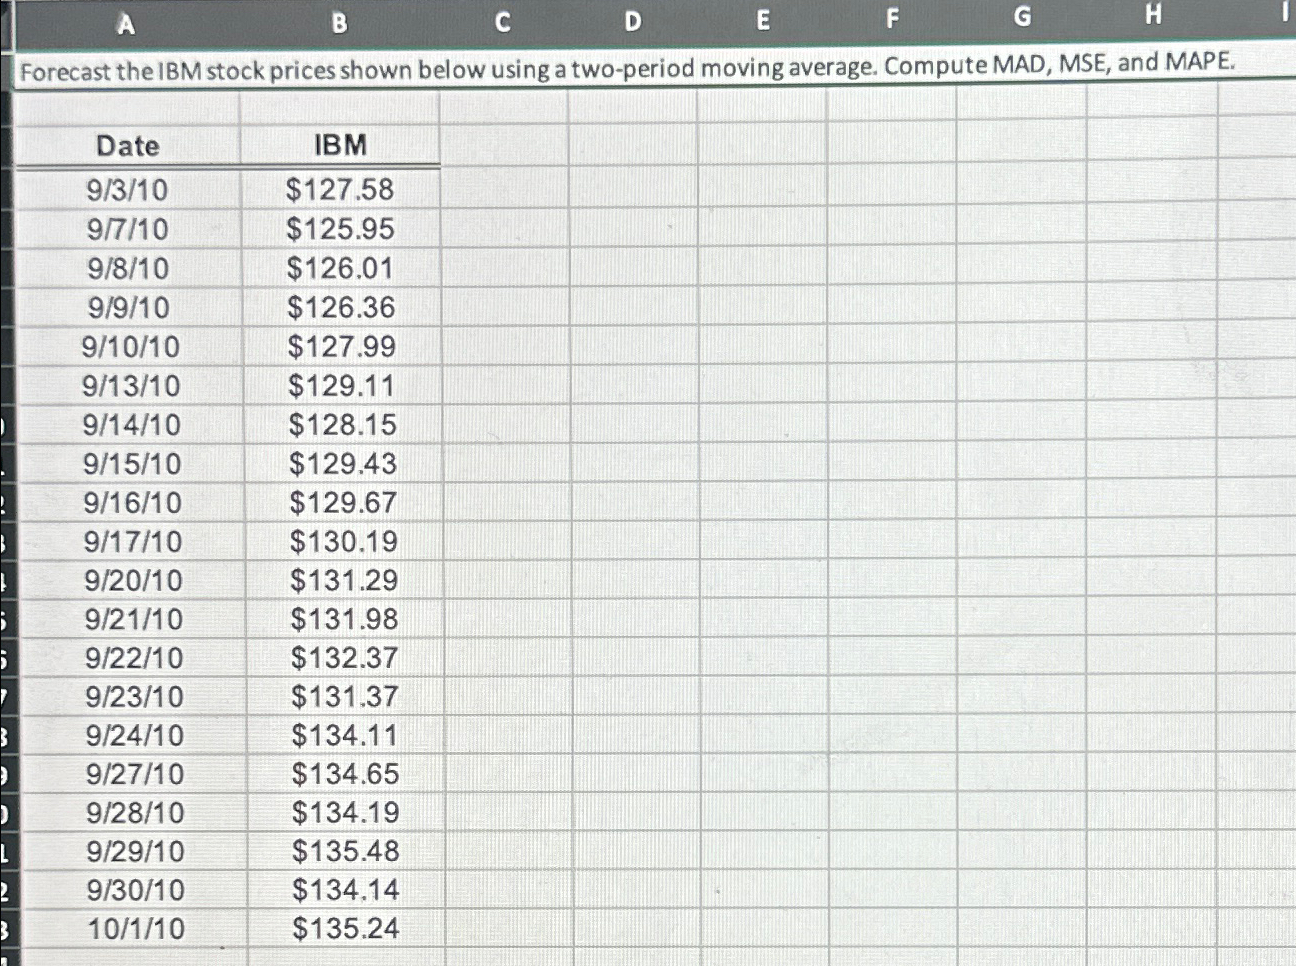
Question: Forecast the IBM stock prices shown below using a two - period moving average. Compute MAD, MSE, and MAPE. table [ [ Date ,
Forecast the IBM stock prices shown below using a twoperiod moving average. Compute MAD, MSE, and MAPE.
tableDateIBM$
Step by Step Solution
There are 3 Steps involved in it
1 Expert Approved Answer
Step: 1 Unlock

Question Has Been Solved by an Expert!
Get step-by-step solutions from verified subject matter experts
Step: 2 Unlock
Step: 3 Unlock