Question: 68 A B D E F G H 3 Assignment 1 of 3: How many lawn mowers will I sell next year? 4 Refer to
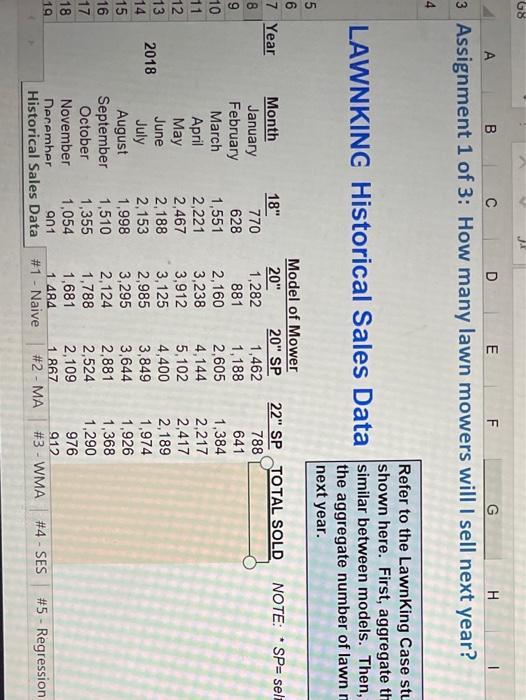
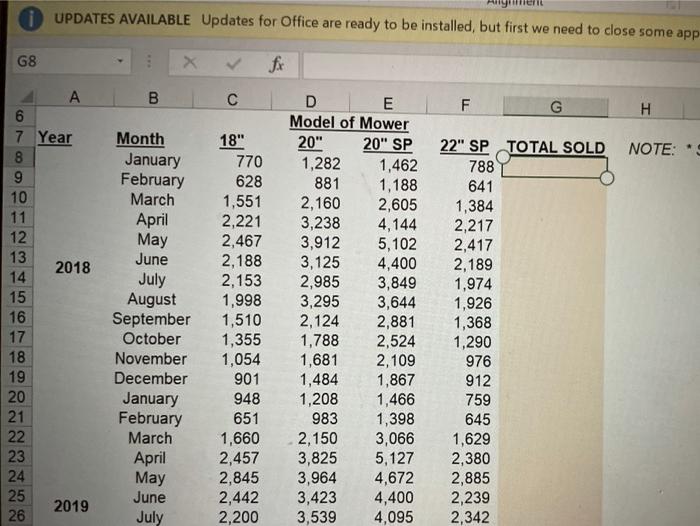
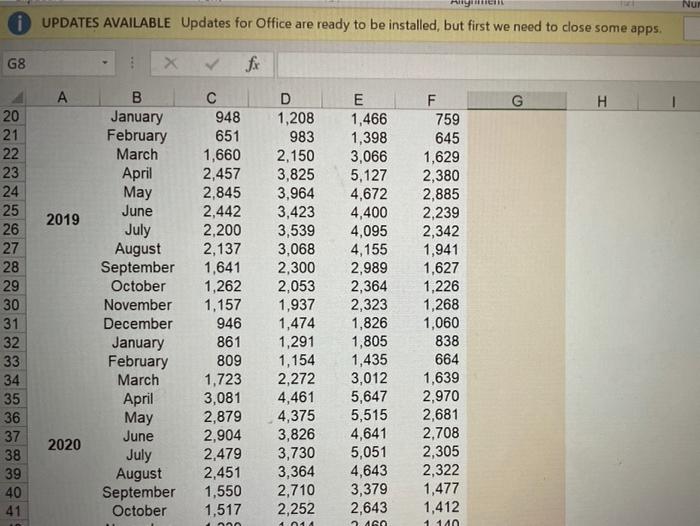
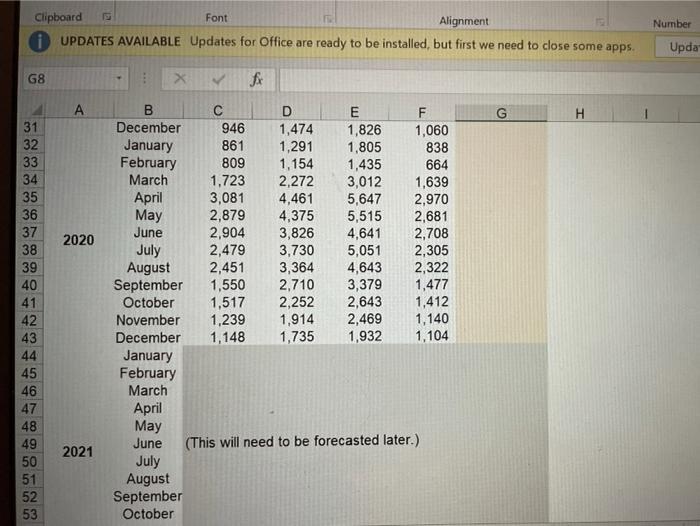
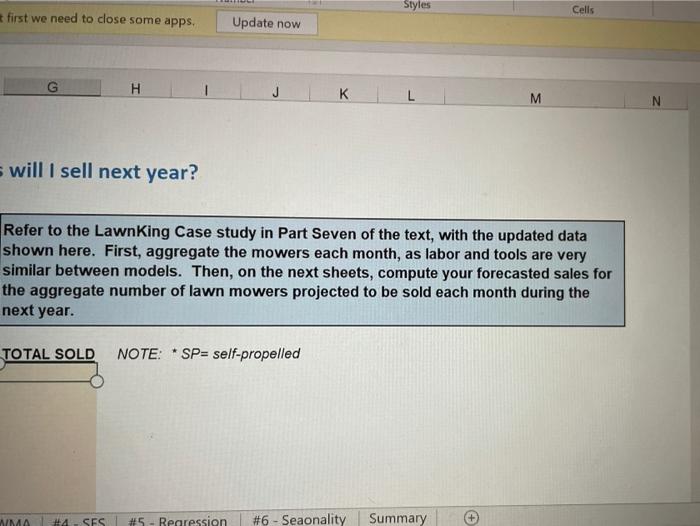
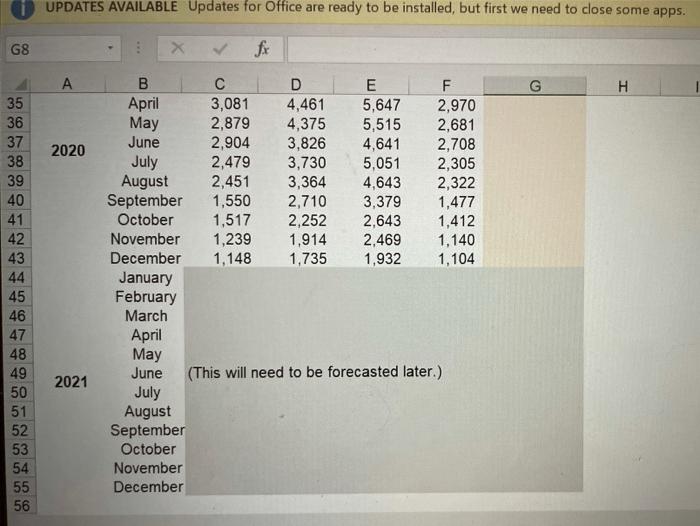
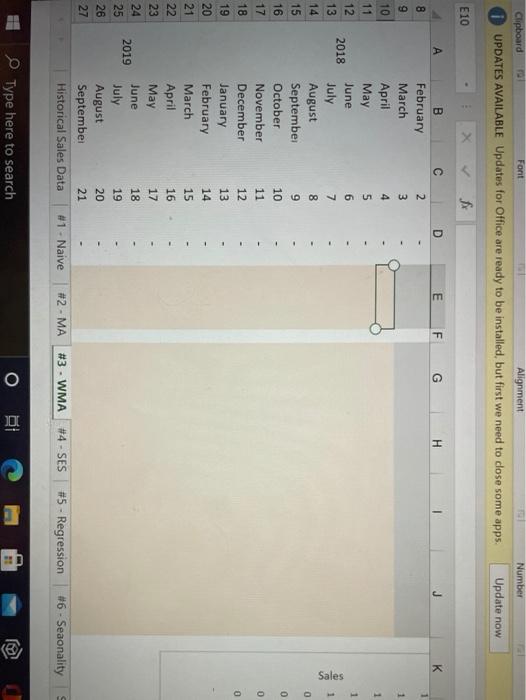
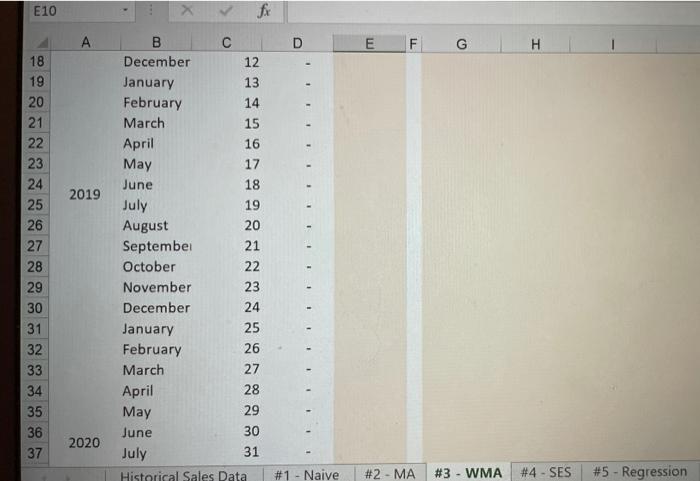
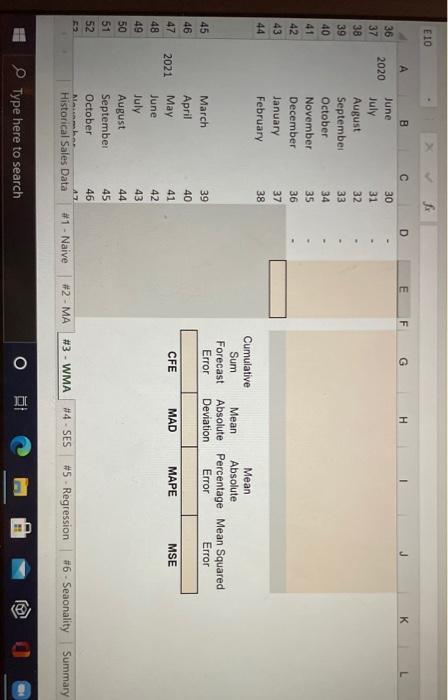
68 A B D E F G H 3 Assignment 1 of 3: How many lawn mowers will I sell next year? 4 Refer to the LawnKing Case stu shown here. First, aggregate th LAWNKING Historical Sales Data similar between models. Then, the aggregate number of lawn 5 next year. 6 Model of Mower 7 Year Month 18" 20" 20" SP 22" SP TOTAL SOLD NOTE: SP= sel- 8 January 770 1,282 1,462 788 February 628 881 1,188 641 10 March 1,551 2,160 2,605 1,384 11 April 2,221 3,238 4,144 2,217 12 May 2,467 3,912 5,102 2,417 13 June 2,188 3,125 4,400 2,189 2018 14 2,153 2,985 3,849 1,974 15 August 1,998 3,295 3,644 1,926 16 September 1,510 2,124 2.881 1,368 17 October 1,355 1,788 2,524 1,290 18 November 1,054 1,681 2,109 976 19 December an1 1 484 1 867 912 Historical Sales Data #1 - Naive #2 - MA #3 - WMA #4 - SES #5 - Regression July O O O O A UPDATES AVAILABLE Updates for Office are ready to be installed, but first we need to close some app G8 X B IC F G H NOTE: 9 A 6 7 Year 8 9 10 11 12 13 2018 14 15 16 17 18 19 20 21 22 23 24 25 2019 26 Month January February March April May June July August September October November December January February March April May June July 18" 770 628 1,551 2,221 2,467 2,188 2,153 1,998 1,510 1,355 1,054 901 948 651 1,660 2,457 2,845 2,442 2,200 D E Model of Mower 20" 20" SP 1,282 1,462 881 1,188 2,160 2,605 3,238 4,144 3,912 5,102 3,125 4,400 2,985 3,849 3,295 3,644 2,124 2,881 1,788 2,524 1,681 2,109 1,484 1,867 1,208 1,466 983 1,398 2,150 3,066 3,825 5,127 3,964 4,672 3,423 4,400 3,539 4,095 22" SP TOTAL SOLD 788 641 1,384 2,217 2,417 2,189 1,974 1,926 1,368 1,290 976 912 759 645 1,629 2,380 2,885 2,239 2,342 Nur i UPDATES AVAILABLE Updates for Office are ready to be installed, but first we need to close some apps. G8 X A G H 20 2019 21 22 23 24 25 26 27 28 29 30 31 32 33 34 35 36 37 38 39 40 41 B January February March April May June July August September October November December January February March April May June July August September October 948 651 1,660 2,457 2,845 2,442 2,200 2,137 1,641 1,262 1,157 946 861 809 1,723 3,081 2,879 2,904 2,479 2,451 1,550 1,517 D 1,208 983 2,150 3,825 3,964 3,423 3,539 3,068 2,300 2,053 1,937 1,474 1,291 1,154 2,272 4,461 4,375 3,826 3,730 3,364 2,710 2,252 E 1,466 1,398 3,066 5,127 4,672 4,400 4,095 4,155 2,989 2,364 2,323 1,826 1,805 1,435 3,012 5,647 5,515 4,641 5,051 4,643 3,379 2,643 F 759 645 1,629 2,380 2,885 2,239 2,342 1,941 1,627 1,226 1,268 1,060 838 664 1,639 2,970 2,681 2,708 2,305 2,322 1,477 1,412 1 14n 2020 ann 4 AGO Font Alignment Number Clipboard i UPDATES AVAILABLE Updates for Office are ready to be installed, but first we need to close some apps. Upda G8 X $ G H 2020 31 32 33 34 35 36 37 38 39 40 41 42 43 44 45 46 47 48 49 50 51 52 53 B D F December 946 1,474 1,826 1,060 January 861 1,291 1,805 838 February 809 1,154 1,435 664 March 1,723 2,272 3,012 1,639 April 3,081 4,461 5,647 2,970 May 2,879 4,375 5,515 2,681 June 2,904 3,826 4,641 2,708 July 2,479 3,730 5,051 2,305 August 2,451 3,364 4,643 2,322 September 1,550 2.710 3,379 1,477 October 1,517 2,252 2,643 1,412 November 1,239 1,914 2,469 1,140 December 1,148 1,735 1,932 1,104 January February March April May June (This will need to be forecasted later.) July August September October 2021 Styles Cells first we need to close some apps. Update now H K M = will I sell next year? Refer to the LawnKing Case study in Part Seven of the text, with the updated data shown here. First, aggregate the mowers each month, as labor and tools are very similar between models. Then, on the next sheets, compute your forecasted sales for the aggregate number of lawn mowers projected to be sold each month during the next year. TOTAL SOLD NOTE: * SP= self-propelled #ASES #5 - Regression #6 - Seaonality Summary UPDATES AVAILABLE Updates for Office are ready to be installed, but first we need to close some apps. G8 X fx G H 35 36 37 38 2020 39 40 41 42 43 44 D E F April 3,081 4,461 5,647 2,970 May 2,879 4,375 5,515 2,681 June 2,904 3,826 4,641 2,708 July 2,479 3,730 5,051 2,305 August 2,451 3,364 4,643 2,322 September 1,550 2,710 3,379 1,477 October 1,517 2,252 2,643 1,412 November 1,239 1,914 2,469 1,140 December 1,148 1,735 1,932 1,104 January February March April May June (This will need to be forecasted later.) July August September October November December 45 2021 46 47 48 49 50 51 52 53 54 55 56 E10 P B H D G Weighted Moving Average - compute a 3-period (month) moving average forecast, using the weights provided below. Weights UN 20% Hint: Remember to use the sto lock cells when copying you don't want the reference cell to changel Oldest (rd month Next oldest (2nd month) Newest (ist month 30% 50% ABS Percentage Weighted Moving Average 3 Historical Sales WMA Period Error 0 Year error Abs(error) Error Squared 7 1 2 Month January February March April May 9 3 10 4 11 5 12 June 6 2018 Sale 13 July 7 O 14 15 August 8 September 9 October 10 Historical Sales Data 15 #6 Sesonality Summary 22 - MA 1 Naive #4 SES S-Regression #3 - WMA Mercat Insert Delete Format Conditional Forms Cell Formatting Table styles Styles Clear - Sant Find & Filter Select Editing Number Cells Alignment installed, but first we need to close some apps Update now G K M P Q R H compute a 3-period (month) moving eights provided below. Hint: Remember to use the $ to lock cells when copying -- if you don't want the reference cell to change! ABS Percentage Weighted Moving Average - 3 months Error Abs[error) error Error Squared 1 1 1 1 1 Sales 1 0 #3 - WMA 14 - SES 85 - Regression #6 - Seaonality Summary 1003 O 18) 4:02 PM la 6/10/2021 DELL Font Alignment Number Update now Clipboard UPDATES AVAILABLE Updates for Office are ready to be installed, but first we need to close some apps. f E10 A B D E H K 8 2 1 February March April 9 1 10 4 1 11 May 5 June 6 12 13 2018 7 Sales 14 8 July August September October 15 9 0 16 10 17 November 11 0 18 December 12 19 13 20 January February March 14 21 15 22 April 16 23 May 17 24 June 18 2019 25 26 27 July 19 August 20 September 21 Historical Sales Data #1 - Naive #2 - MA #3 - WMA #4 - SES #5 - Regression #6 - Seaonality Type here to search O DI E10 fx B D E E G H H 18 December 12 19 13 20 January February March 14 15 16 NNNN April May 17 June 18 2019 25 19 26 20 July August Septembel October 27 21 28 22 29 November 23 30 December 24 31 25 32 January February March 26 33 27 34 28 35 April May June 29 36 30 2020 37 July 31 Historical Sales Data #1 - Naive #2 - MA #3 - WMA #4 - SES #5 - Regression EIO A B D E H K 36 June 30 2020 37 31 38 32 39 July August September October November 33 40 34 35 41 42 December 36 43 37 January February 44 38 Cumulative Sum Forecast Error Mean Mean Absolute Absolute Percentage Mean Squared Deviation Error Error 45 March 46 40 CFE 2021 MAD MAPE 47 48 MSE 42 April May June July August September October 49 50 44 51 52 Naimer Historical Sales Data #1 - Naive #2 - MA #3 - WMA #4 - SES #5 - Regression #6 - Seaonality Summary Type here to search O 68 A B D E F G H 3 Assignment 1 of 3: How many lawn mowers will I sell next year? 4 Refer to the LawnKing Case stu shown here. First, aggregate th LAWNKING Historical Sales Data similar between models. Then, the aggregate number of lawn 5 next year. 6 Model of Mower 7 Year Month 18" 20" 20" SP 22" SP TOTAL SOLD NOTE: SP= sel- 8 January 770 1,282 1,462 788 February 628 881 1,188 641 10 March 1,551 2,160 2,605 1,384 11 April 2,221 3,238 4,144 2,217 12 May 2,467 3,912 5,102 2,417 13 June 2,188 3,125 4,400 2,189 2018 14 2,153 2,985 3,849 1,974 15 August 1,998 3,295 3,644 1,926 16 September 1,510 2,124 2.881 1,368 17 October 1,355 1,788 2,524 1,290 18 November 1,054 1,681 2,109 976 19 December an1 1 484 1 867 912 Historical Sales Data #1 - Naive #2 - MA #3 - WMA #4 - SES #5 - Regression July O O O O A UPDATES AVAILABLE Updates for Office are ready to be installed, but first we need to close some app G8 X B IC F G H NOTE: 9 A 6 7 Year 8 9 10 11 12 13 2018 14 15 16 17 18 19 20 21 22 23 24 25 2019 26 Month January February March April May June July August September October November December January February March April May June July 18" 770 628 1,551 2,221 2,467 2,188 2,153 1,998 1,510 1,355 1,054 901 948 651 1,660 2,457 2,845 2,442 2,200 D E Model of Mower 20" 20" SP 1,282 1,462 881 1,188 2,160 2,605 3,238 4,144 3,912 5,102 3,125 4,400 2,985 3,849 3,295 3,644 2,124 2,881 1,788 2,524 1,681 2,109 1,484 1,867 1,208 1,466 983 1,398 2,150 3,066 3,825 5,127 3,964 4,672 3,423 4,400 3,539 4,095 22" SP TOTAL SOLD 788 641 1,384 2,217 2,417 2,189 1,974 1,926 1,368 1,290 976 912 759 645 1,629 2,380 2,885 2,239 2,342 Nur i UPDATES AVAILABLE Updates for Office are ready to be installed, but first we need to close some apps. G8 X A G H 20 2019 21 22 23 24 25 26 27 28 29 30 31 32 33 34 35 36 37 38 39 40 41 B January February March April May June July August September October November December January February March April May June July August September October 948 651 1,660 2,457 2,845 2,442 2,200 2,137 1,641 1,262 1,157 946 861 809 1,723 3,081 2,879 2,904 2,479 2,451 1,550 1,517 D 1,208 983 2,150 3,825 3,964 3,423 3,539 3,068 2,300 2,053 1,937 1,474 1,291 1,154 2,272 4,461 4,375 3,826 3,730 3,364 2,710 2,252 E 1,466 1,398 3,066 5,127 4,672 4,400 4,095 4,155 2,989 2,364 2,323 1,826 1,805 1,435 3,012 5,647 5,515 4,641 5,051 4,643 3,379 2,643 F 759 645 1,629 2,380 2,885 2,239 2,342 1,941 1,627 1,226 1,268 1,060 838 664 1,639 2,970 2,681 2,708 2,305 2,322 1,477 1,412 1 14n 2020 ann 4 AGO Font Alignment Number Clipboard i UPDATES AVAILABLE Updates for Office are ready to be installed, but first we need to close some apps. Upda G8 X $ G H 2020 31 32 33 34 35 36 37 38 39 40 41 42 43 44 45 46 47 48 49 50 51 52 53 B D F December 946 1,474 1,826 1,060 January 861 1,291 1,805 838 February 809 1,154 1,435 664 March 1,723 2,272 3,012 1,639 April 3,081 4,461 5,647 2,970 May 2,879 4,375 5,515 2,681 June 2,904 3,826 4,641 2,708 July 2,479 3,730 5,051 2,305 August 2,451 3,364 4,643 2,322 September 1,550 2.710 3,379 1,477 October 1,517 2,252 2,643 1,412 November 1,239 1,914 2,469 1,140 December 1,148 1,735 1,932 1,104 January February March April May June (This will need to be forecasted later.) July August September October 2021 Styles Cells first we need to close some apps. Update now H K M = will I sell next year? Refer to the LawnKing Case study in Part Seven of the text, with the updated data shown here. First, aggregate the mowers each month, as labor and tools are very similar between models. Then, on the next sheets, compute your forecasted sales for the aggregate number of lawn mowers projected to be sold each month during the next year. TOTAL SOLD NOTE: * SP= self-propelled #ASES #5 - Regression #6 - Seaonality Summary UPDATES AVAILABLE Updates for Office are ready to be installed, but first we need to close some apps. G8 X fx G H 35 36 37 38 2020 39 40 41 42 43 44 D E F April 3,081 4,461 5,647 2,970 May 2,879 4,375 5,515 2,681 June 2,904 3,826 4,641 2,708 July 2,479 3,730 5,051 2,305 August 2,451 3,364 4,643 2,322 September 1,550 2,710 3,379 1,477 October 1,517 2,252 2,643 1,412 November 1,239 1,914 2,469 1,140 December 1,148 1,735 1,932 1,104 January February March April May June (This will need to be forecasted later.) July August September October November December 45 2021 46 47 48 49 50 51 52 53 54 55 56 E10 P B H D G Weighted Moving Average - compute a 3-period (month) moving average forecast, using the weights provided below. Weights UN 20% Hint: Remember to use the sto lock cells when copying you don't want the reference cell to changel Oldest (rd month Next oldest (2nd month) Newest (ist month 30% 50% ABS Percentage Weighted Moving Average 3 Historical Sales WMA Period Error 0 Year error Abs(error) Error Squared 7 1 2 Month January February March April May 9 3 10 4 11 5 12 June 6 2018 Sale 13 July 7 O 14 15 August 8 September 9 October 10 Historical Sales Data 15 #6 Sesonality Summary 22 - MA 1 Naive #4 SES S-Regression #3 - WMA Mercat Insert Delete Format Conditional Forms Cell Formatting Table styles Styles Clear - Sant Find & Filter Select Editing Number Cells Alignment installed, but first we need to close some apps Update now G K M P Q R H compute a 3-period (month) moving eights provided below. Hint: Remember to use the $ to lock cells when copying -- if you don't want the reference cell to change! ABS Percentage Weighted Moving Average - 3 months Error Abs[error) error Error Squared 1 1 1 1 1 Sales 1 0 #3 - WMA 14 - SES 85 - Regression #6 - Seaonality Summary 1003 O 18) 4:02 PM la 6/10/2021 DELL Font Alignment Number Update now Clipboard UPDATES AVAILABLE Updates for Office are ready to be installed, but first we need to close some apps. f E10 A B D E H K 8 2 1 February March April 9 1 10 4 1 11 May 5 June 6 12 13 2018 7 Sales 14 8 July August September October 15 9 0 16 10 17 November 11 0 18 December 12 19 13 20 January February March 14 21 15 22 April 16 23 May 17 24 June 18 2019 25 26 27 July 19 August 20 September 21 Historical Sales Data #1 - Naive #2 - MA #3 - WMA #4 - SES #5 - Regression #6 - Seaonality Type here to search O DI E10 fx B D E E G H H 18 December 12 19 13 20 January February March 14 15 16 NNNN April May 17 June 18 2019 25 19 26 20 July August Septembel October 27 21 28 22 29 November 23 30 December 24 31 25 32 January February March 26 33 27 34 28 35 April May June 29 36 30 2020 37 July 31 Historical Sales Data #1 - Naive #2 - MA #3 - WMA #4 - SES #5 - Regression EIO A B D E H K 36 June 30 2020 37 31 38 32 39 July August September October November 33 40 34 35 41 42 December 36 43 37 January February 44 38 Cumulative Sum Forecast Error Mean Mean Absolute Absolute Percentage Mean Squared Deviation Error Error 45 March 46 40 CFE 2021 MAD MAPE 47 48 MSE 42 April May June July August September October 49 50 44 51 52 Naimer Historical Sales Data #1 - Naive #2 - MA #3 - WMA #4 - SES #5 - Regression #6 - Seaonality Summary Type here to search O