

Question: forecast Total Net Sales for 2017. Round to the second decimal place Income Statement Actual 2011 2009 2010 2012 2013 2014 Net sales Cost of
forecast Total Net Sales for 2017. Round to the second decimal place
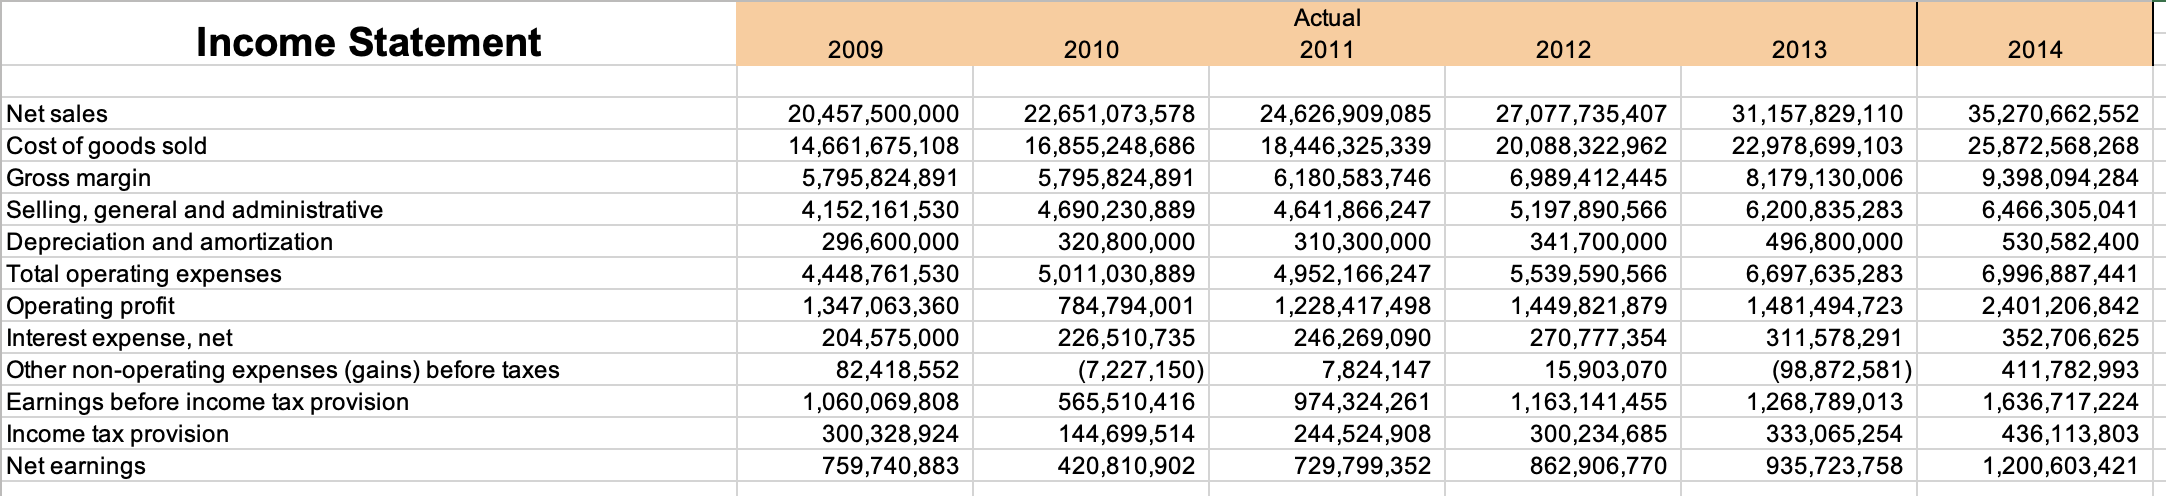
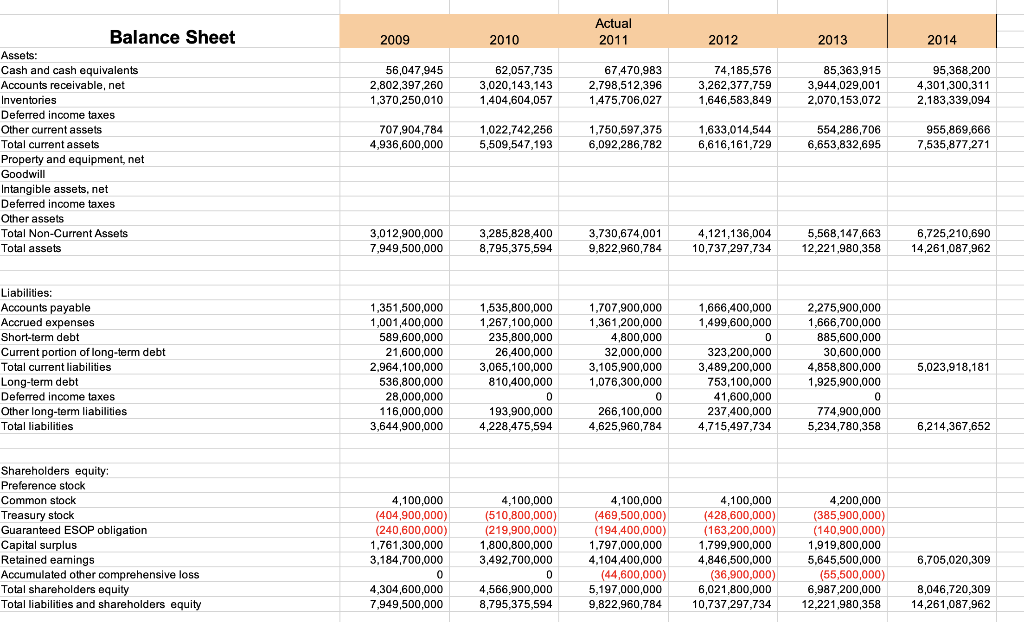
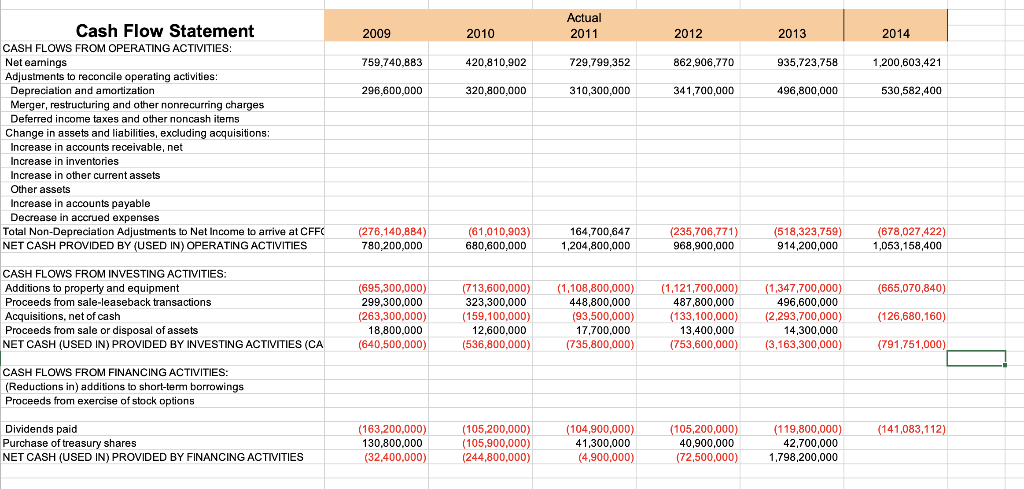
Income Statement Actual 2011 2009 2010 2012 2013 2014 Net sales Cost of goods sold Gross margin Selling, general and administrative Depreciation and amortization Total operating expenses Operating profit Interest expense, net Other non-operating expenses (gains) before taxes Earnings before income tax provision Income tax provision Net earnings 20,457,500,000 14,661,675,108 5,795,824,891 4,152,161,530 296,600,000 4,448,761,530 1,347,063,360 204,575,000 82,418,552 1,060,069,808 300,328,924 759,740,883 22,651,073,578 16,855,248,686 5,795,824,891 4,690,230,889 320,800,000 5,011,030,889 784,794,001 226,510,735 (7,227,150) 565,510,416 144,699,514 420,810,902 24,626,909,085 18,446,325,339 6,180,583,746 4,641,866,247 310,300,000 4,952,166,247 1,228,417,498 246,269,090 7,824,147 974,324,261 244,524,908 729,799,352 27,077,735,407 20,088,322,962 6,989,412,445 5,197,890,566 341,700,000 5,539,590,566 1,449,821,879 270,777,354 15,903,070 1,163,141,455 300,234,685 862,906,770 31,157,829,110 22,978,699,103 8,179,130,006 6,200,835,283 496,800,000 6,697,635,283 1,481,494,723 311,578,291 (98,872,581) 1,268,789,013 333,065,254 935,723,758 35,270,662,552 25,872,568,268 9,398,094,284 6,466,305,041 530,582,400 6,996,887,441 2,401,206,842 352,706,625 411,782,993 1,636,717,224 436,113,803 1,200,603,421 Actual 2011 2009 2010 2012 2013 2014 56,047,945 2,802,397,260 1,370,250,010 62,057,735 3,020,143,143 1,404,604,057 67,470,983 2.798,512,396 1,475,706,027 74,185,576 3,262,377,759 1,646,583,849 85,363,915 3,944,029,001 2.070,153,072 95,368,200 4,301,300,311 2,183,339,094 Balance Sheet Assets: Cash and cash equivalents Accounts receivable, net Inventories Deferred income taxes Other current assets Total current assets Property and equipment, net Goodwill Intangible assets, net Deferred income taxes Other assets Total Non-Current Assets Total assets 707,904,784 4,936,600,000 1,022,742,256 5,509,547,193 1,750,597,375 6,092,286,782 1,633,014,544 6,616,161,729 554,286,706 6,653,832,695 955,869,666 7,535,877,271 3,012,900,000 7,949,500,000 3,285,828,400 8,795,375,594 3,730,674,001 9,822,960,784 4,121,136,004 10,737,297,734 5,568,147,663 12,221,980,358 6,725,210,690 14,261,087,962 Liabilities: Accounts payable Accrued expenses Short-term debt Current portion of long-term debt Total current liabilities Long-term debt Deferred income taxes Other long-term liabilities Total liabilities 1,351,500,000 1,001,400,000 589,600,000 21,600,000 2,964,100,000 536,800,000 28,000,000 116,000,000 3,644,900,000 1,535,800,000 1,267,100,000 235,800,000 26,400.000 3,065,100,000 810,400,000 0 193,900,000 4,228,475,594 1,707,900,000 1,361,200,000 4,800,000 32,000,000 3,105,900,000 1,076,300,000 0 266,100,000 4,625,960,784 1,666,400,000 1,499,600,000 0 323,200,000 3,489,200,000 753,100,000 41,600,000 237,400,000 4,715,497,734 2,275,900,000 1,666,700,000 885,600,000 30,600,000 4,858,800,000 1,925,900,000 0 0 774,900,000 5,234,780,358 5,023,918,181 6,214,367,652 Shareholders equity: Preference stock Common stock Treasury stock Guaranteed ESOP obligation Capital surplus Retained earnings Accumulated other comprehensive loss Total shareholders equity Total liabilities and shareholders equity 4,100,000 (404,900,000) (240,600,000) 1,761,300,000 3,184,700,000 0 4,304,600,000 7,949,500,000 4,100,000 (510,800,000) (219,900,000) 1,800,800,000 3,492,700,000 0 4,566,900,000 8,795,375,594 4,100,000 (469,500,000) (194,400,000) 1.797,000,000 4,104,400,000 (44,600,000) 5,197,000,000 9,822,960,784 4,100,000 (428,600,000) (163,200,000) 1,799,900,000 4,846,500,000 (36,900,000) 6,021,800,000 10,737,297,734 4,200,000 (385,900,000) (140,900,000) 1.919,800,000 5,645,500,000 (55,500,000) 6,987,200,000 12,221,980,358 6,705,020,309 8,046,720,309 14,261,087,962 Actual 2011 2009 2010 2012 2013 2014 759.740.883 420,810,902 729,799,352 862,906,770 935,723,758 1,200,603,421 296,600,000 320,800,000 310,300,000 341,700,000 496,800,000 530,582,400 Cash Flow Statement CASH FLOWS FROM OPERATING ACTIVITIES: Net earnings Adjustments to reconcile operating activities: Depreciation and amortization Merger, restructuring and other nonrecurring charges Deferred income taxes and other noncash items Change in assets and liabilities, excluding acquisitions: Increase in accounts receivable, net Increase in inventories Increase in other current assets Other assets Increase in accounts payable Decrease in accrued expenses Total Non-Depreciation Adjustments to Net Income to arrive at CFFC NET CASH PROVIDED BY (USED IN) OPERATING ACTIVITIES (278,140,884) 780,200,000 (61,010,903) 680,600,000 164,700,647 1,204,800,000 (235,706,771) 968,900,000 (518,323,759) 914,200,000 (678,027,422) 1,053,158,400 (665,070,840) CASH FLOWS FROM INVESTING ACTIVITIES Additions to property and equipment Proceeds from sale-leaseback transactions Acquisitions, net of cash Proceeds from sale or disposal of assets NET CASH (USED IN) PROVIDED BY INVESTING ACTIVITIES (CA (695,300,000) 299,300,000 (263,300,000) 18.800,000 (640,500,000) (713,600,000) 323,300,000 (159,100,000) 12,600.000 (536,800,000) (1,108,800,000) 448,800,000 (93,500,000) 17,700.000 (735,800,000) (1,121,700,000) 487,800,000 (133,100,000) 13,400,000 (753,600,000) (1,347,700,000) 496,600,000 (2,293,700,000) 14,300,000 (3,163,300,000) (126,680,160) (791,751,000) CASH FLOWS FROM FINANCING ACTIVITIES: (Reductions in) additions to short-term borrowings Proceeds from exercise of stock options (141,083,112) Dividends paid Purchase of treasury shares NET CASH (USED IN) PROVIDED BY FINANCING ACTIVITIES (163,200,000) 130,800,000 (32,400,000) (105,200,000) (105,900,000) (244,800,000) (104,900,000) 41,300,000 (4,900,000) (105,200,000) 40,900,000 (72,500,000) (119,800,000) 42,700,000 1,798,200,000 Income Statement Actual 2011 2009 2010 2012 2013 2014 Net sales Cost of goods sold Gross margin Selling, general and administrative Depreciation and amortization Total operating expenses Operating profit Interest expense, net Other non-operating expenses (gains) before taxes Earnings before income tax provision Income tax provision Net earnings 20,457,500,000 14,661,675,108 5,795,824,891 4,152,161,530 296,600,000 4,448,761,530 1,347,063,360 204,575,000 82,418,552 1,060,069,808 300,328,924 759,740,883 22,651,073,578 16,855,248,686 5,795,824,891 4,690,230,889 320,800,000 5,011,030,889 784,794,001 226,510,735 (7,227,150) 565,510,416 144,699,514 420,810,902 24,626,909,085 18,446,325,339 6,180,583,746 4,641,866,247 310,300,000 4,952,166,247 1,228,417,498 246,269,090 7,824,147 974,324,261 244,524,908 729,799,352 27,077,735,407 20,088,322,962 6,989,412,445 5,197,890,566 341,700,000 5,539,590,566 1,449,821,879 270,777,354 15,903,070 1,163,141,455 300,234,685 862,906,770 31,157,829,110 22,978,699,103 8,179,130,006 6,200,835,283 496,800,000 6,697,635,283 1,481,494,723 311,578,291 (98,872,581) 1,268,789,013 333,065,254 935,723,758 35,270,662,552 25,872,568,268 9,398,094,284 6,466,305,041 530,582,400 6,996,887,441 2,401,206,842 352,706,625 411,782,993 1,636,717,224 436,113,803 1,200,603,421 Actual 2011 2009 2010 2012 2013 2014 56,047,945 2,802,397,260 1,370,250,010 62,057,735 3,020,143,143 1,404,604,057 67,470,983 2.798,512,396 1,475,706,027 74,185,576 3,262,377,759 1,646,583,849 85,363,915 3,944,029,001 2.070,153,072 95,368,200 4,301,300,311 2,183,339,094 Balance Sheet Assets: Cash and cash equivalents Accounts receivable, net Inventories Deferred income taxes Other current assets Total current assets Property and equipment, net Goodwill Intangible assets, net Deferred income taxes Other assets Total Non-Current Assets Total assets 707,904,784 4,936,600,000 1,022,742,256 5,509,547,193 1,750,597,375 6,092,286,782 1,633,014,544 6,616,161,729 554,286,706 6,653,832,695 955,869,666 7,535,877,271 3,012,900,000 7,949,500,000 3,285,828,400 8,795,375,594 3,730,674,001 9,822,960,784 4,121,136,004 10,737,297,734 5,568,147,663 12,221,980,358 6,725,210,690 14,261,087,962 Liabilities: Accounts payable Accrued expenses Short-term debt Current portion of long-term debt Total current liabilities Long-term debt Deferred income taxes Other long-term liabilities Total liabilities 1,351,500,000 1,001,400,000 589,600,000 21,600,000 2,964,100,000 536,800,000 28,000,000 116,000,000 3,644,900,000 1,535,800,000 1,267,100,000 235,800,000 26,400.000 3,065,100,000 810,400,000 0 193,900,000 4,228,475,594 1,707,900,000 1,361,200,000 4,800,000 32,000,000 3,105,900,000 1,076,300,000 0 266,100,000 4,625,960,784 1,666,400,000 1,499,600,000 0 323,200,000 3,489,200,000 753,100,000 41,600,000 237,400,000 4,715,497,734 2,275,900,000 1,666,700,000 885,600,000 30,600,000 4,858,800,000 1,925,900,000 0 0 774,900,000 5,234,780,358 5,023,918,181 6,214,367,652 Shareholders equity: Preference stock Common stock Treasury stock Guaranteed ESOP obligation Capital surplus Retained earnings Accumulated other comprehensive loss Total shareholders equity Total liabilities and shareholders equity 4,100,000 (404,900,000) (240,600,000) 1,761,300,000 3,184,700,000 0 4,304,600,000 7,949,500,000 4,100,000 (510,800,000) (219,900,000) 1,800,800,000 3,492,700,000 0 4,566,900,000 8,795,375,594 4,100,000 (469,500,000) (194,400,000) 1.797,000,000 4,104,400,000 (44,600,000) 5,197,000,000 9,822,960,784 4,100,000 (428,600,000) (163,200,000) 1,799,900,000 4,846,500,000 (36,900,000) 6,021,800,000 10,737,297,734 4,200,000 (385,900,000) (140,900,000) 1.919,800,000 5,645,500,000 (55,500,000) 6,987,200,000 12,221,980,358 6,705,020,309 8,046,720,309 14,261,087,962 Actual 2011 2009 2010 2012 2013 2014 759.740.883 420,810,902 729,799,352 862,906,770 935,723,758 1,200,603,421 296,600,000 320,800,000 310,300,000 341,700,000 496,800,000 530,582,400 Cash Flow Statement CASH FLOWS FROM OPERATING ACTIVITIES: Net earnings Adjustments to reconcile operating activities: Depreciation and amortization Merger, restructuring and other nonrecurring charges Deferred income taxes and other noncash items Change in assets and liabilities, excluding acquisitions: Increase in accounts receivable, net Increase in inventories Increase in other current assets Other assets Increase in accounts payable Decrease in accrued expenses Total Non-Depreciation Adjustments to Net Income to arrive at CFFC NET CASH PROVIDED BY (USED IN) OPERATING ACTIVITIES (278,140,884) 780,200,000 (61,010,903) 680,600,000 164,700,647 1,204,800,000 (235,706,771) 968,900,000 (518,323,759) 914,200,000 (678,027,422) 1,053,158,400 (665,070,840) CASH FLOWS FROM INVESTING ACTIVITIES Additions to property and equipment Proceeds from sale-leaseback transactions Acquisitions, net of cash Proceeds from sale or disposal of assets NET CASH (USED IN) PROVIDED BY INVESTING ACTIVITIES (CA (695,300,000) 299,300,000 (263,300,000) 18.800,000 (640,500,000) (713,600,000) 323,300,000 (159,100,000) 12,600.000 (536,800,000) (1,108,800,000) 448,800,000 (93,500,000) 17,700.000 (735,800,000) (1,121,700,000) 487,800,000 (133,100,000) 13,400,000 (753,600,000) (1,347,700,000) 496,600,000 (2,293,700,000) 14,300,000 (3,163,300,000) (126,680,160) (791,751,000) CASH FLOWS FROM FINANCING ACTIVITIES: (Reductions in) additions to short-term borrowings Proceeds from exercise of stock options (141,083,112) Dividends paid Purchase of treasury shares NET CASH (USED IN) PROVIDED BY FINANCING ACTIVITIES (163,200,000) 130,800,000 (32,400,000) (105,200,000) (105,900,000) (244,800,000) (104,900,000) 41,300,000 (4,900,000) (105,200,000) 40,900,000 (72,500,000) (119,800,000) 42,700,000 1,798,200,000
Step by Step Solution
There are 3 Steps involved in it

Get step-by-step solutions from verified subject matter experts