

Question: Forecasting Case Study: New Business Planning Important Note: Students must access the Entrepreneurship and the U.S. Economy page of the Bureau of Labor Statistics website
Forecasting Case Study: New Business Planning
Important Note: Students must access the Entrepreneurship and the U.S. Economy page of the Bureau of Labor Statistics website in order to complete this assignment.
Scenario
The generation of new business start-up is vital to the growth of the economy as it builds new jobs and creates new opportunities for the community. The Bureau of Labor Statistics tracks new business development and jobs created on the website for the United States Department of Labor. You have been tasked with forecasting economic growth and decline patterns for new businesses in the United States.
Forecasting
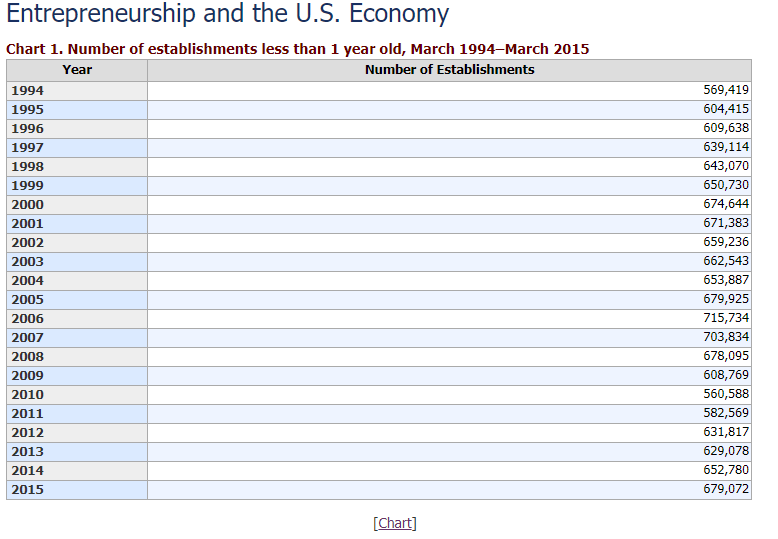
Access the Entrepreneurship and the U.S. Economy page of the Bureau of Labor Statistics website. Under the "Business establishment age" heading, the first chart reviews new businesses less than 1 year old during the March 1994 to March 2015 period. Click on the [Chart data] link below the chart:
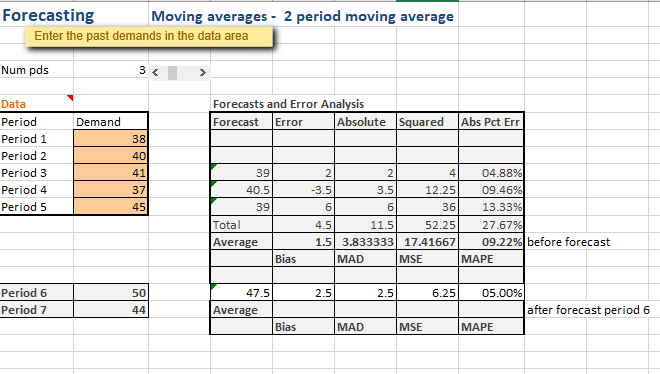
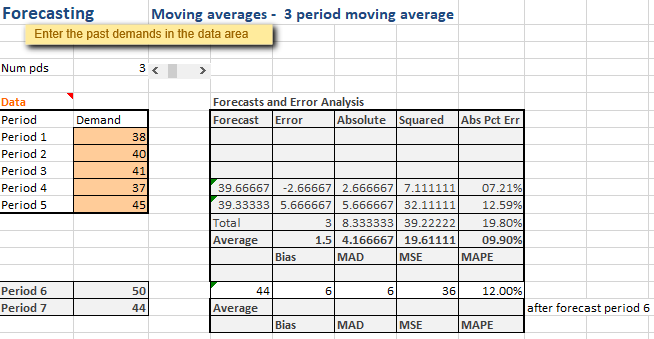
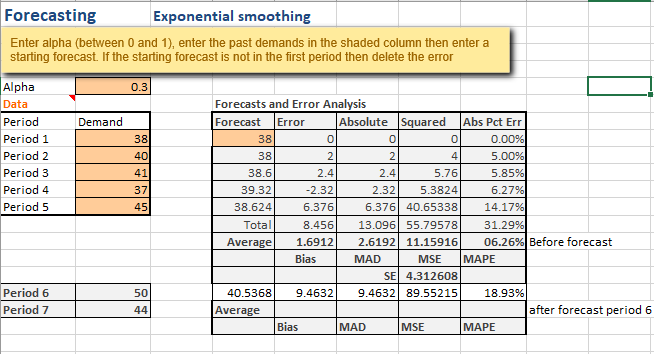
Using the five most recent years and the "Forecasting Template" spreadsheet provided, complete the forecasts for the next two periods and provide updated Totals and Average Bias, median absolute deviation (MAD), mean squared error (MSE), and mean absolute percentage error (MAPE) for all four charts. Provide a Summary Page in Excel with a 500-750 word report on the analysis completed by the forecasting models. Include review of error, recommendations on the best forecasting model to use, and analysis of the business trend data for new business startup in the United States.
I'm not exactly sure how to set up the formulas. Can you please provide a step-by-step guide?
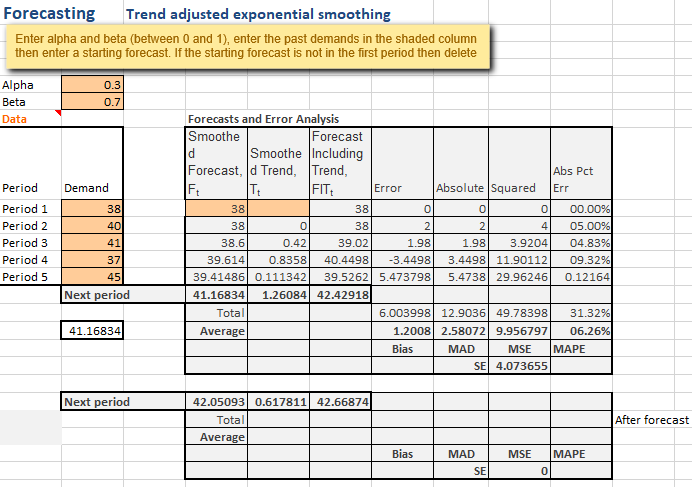
Entrepreneurship and the U.S. Economy Chart 1. Number of establishments less than 1 year old, March 1994March 2015 Year Number of Establishments 1994 1995 1996 1997 1998 1999 2000 2001 2002 2003 2004 569,419 604,415 609,638 639,114 643,070 650,730 674,644 671,383 659,236 662,543 653,887 679,925 715,734 703,834 678,095 608,769 560,588 582,569 631,817 629,078 652,780 679,072 2005 2006 2007 2008 2009 2010 2011 2012 2013 2014 2015 [Chart] Forecasting Moving averages - 2 period moving average Enter the past demands in the data area Num pds 35 Forecasts and Error Analysis Forecast Error Absolute Squared Demand Abs Pct Err Data Period Period 1 Period 2 Period 3 Period 4 Period 5 38 40 41 39 37 45 40.5 39 2 2 4 04.88% -3.5 3.5 12.25 09.46% 6 6 36 13.33% 4.5 11.5 52.25 27.67% 1.5| 3.833333 17.41667 09.22% before forecast MAD MSE MAPE Total Average Bias 50 2.5 2.5 6.25 05.00% Period 6 Period 7 47.5 Average 44 after forecast period 6 Bias MAD MSE MAPE Forecasting Moving averages - 3 period moving average Enter the past demands in the data area Num pds 35 Forecasts and Error Analysis Forecast Error Absolute Squared Demand Abs Pct Err Data Period Period 1 Period 2 Period 3 Period 4 Period 5 38 40 41 37 45 39.66667 -2.66667) 2.666667 7.111111 07.21% 39.33333 5.666667 5.666667 32.11111 12.59% Total 38.333333] 39.22222 19.80% Average 1.5| 4.166667| 19.61111 09.90% Bias MAD MSE MAPE 6 6 36 12.00% Period 6 Period 7 50 44 44 Average Bias after forecast period 6 MAD MSE MAPE Forecasting Exponential smoothing Enter alpha (between 0 and 1), enter the past demands in the shaded column then enter a starting forecast. If the starting forecast is not in the first period then delete the error 0.3 Demand Alpha Data Period Period 1 Period 2 Period 3 Period 4 Period 5 38 401 411 37 45 Forecasts and Error Analysis Forecast Error Absolute Squared Abs Pct Err 38 0 0 0 0.00% 38 21 2 4 5.00% 38.6 2.4 2.4 5.76 5.85% 39.32 -2.32 2.32 5.3824 6.27% 38.624 6.376 6.376 40.65338 14.17% Total 8.456 13.096 55.79578 31.29% Average 1.6912 2.6192 11.15916 06.26% Before forecast Bias MAD MSE MAPE SE 4.312608 40.5368 9.4632 9.4632 89.55215 18.93% Average after forecast period 6 Bias MAD MSE MAPE Period 6 Period 7 50 44 Forecasting Trend adjusted exponential smoothing Enter alpha and beta (between 0 and 1), enter the past demands in the shaded column then enter a starting forecast. If the starting forecast is not in the first period then delete Alpha Beta Data 0.3 0.7 Demand Period Period 1 Period 2 Period 3 Period 4 Period 5 38 40 41 37 45 Next period Forecasts and Error Analysis Smoothe Forecast d Smoothe Including Forecast, d Trend, Trend, Abs Pct Ft TE FIT Error Absolute Squared Err 38 38 0 0 0 00.00% 38 0 38 2 2 4 05.00% 38.6 0.42 39.02 1.98 1.98 3.9204 04.83% 39.614 0.8358 40.4498 -3.4498 3.4498| 11.90112 09.32% 39.41486 0.111342 39.5262 5.473798 5.4738| 29.96246 0.121641 41.16834 1.26084 42.42918 Total 6.003998 12.9036 49.78398 31.32% Average 1.2008 2.58072| 9.956797 06.26% Bias MAD MSE MAPE SE 4.073655 41.16834 Next period 42.05093 0.617811| 42.66874 Total Average After forecast Bias MAD SE MSE MAPE 0 Entrepreneurship and the U.S. Economy Chart 1. Number of establishments less than 1 year old, March 1994March 2015 Year Number of Establishments 1994 1995 1996 1997 1998 1999 2000 2001 2002 2003 2004 569,419 604,415 609,638 639,114 643,070 650,730 674,644 671,383 659,236 662,543 653,887 679,925 715,734 703,834 678,095 608,769 560,588 582,569 631,817 629,078 652,780 679,072 2005 2006 2007 2008 2009 2010 2011 2012 2013 2014 2015 [Chart] Forecasting Moving averages - 2 period moving average Enter the past demands in the data area Num pds 35 Forecasts and Error Analysis Forecast Error Absolute Squared Demand Abs Pct Err Data Period Period 1 Period 2 Period 3 Period 4 Period 5 38 40 41 39 37 45 40.5 39 2 2 4 04.88% -3.5 3.5 12.25 09.46% 6 6 36 13.33% 4.5 11.5 52.25 27.67% 1.5| 3.833333 17.41667 09.22% before forecast MAD MSE MAPE Total Average Bias 50 2.5 2.5 6.25 05.00% Period 6 Period 7 47.5 Average 44 after forecast period 6 Bias MAD MSE MAPE Forecasting Moving averages - 3 period moving average Enter the past demands in the data area Num pds 35 Forecasts and Error Analysis Forecast Error Absolute Squared Demand Abs Pct Err Data Period Period 1 Period 2 Period 3 Period 4 Period 5 38 40 41 37 45 39.66667 -2.66667) 2.666667 7.111111 07.21% 39.33333 5.666667 5.666667 32.11111 12.59% Total 38.333333] 39.22222 19.80% Average 1.5| 4.166667| 19.61111 09.90% Bias MAD MSE MAPE 6 6 36 12.00% Period 6 Period 7 50 44 44 Average Bias after forecast period 6 MAD MSE MAPE Forecasting Exponential smoothing Enter alpha (between 0 and 1), enter the past demands in the shaded column then enter a starting forecast. If the starting forecast is not in the first period then delete the error 0.3 Demand Alpha Data Period Period 1 Period 2 Period 3 Period 4 Period 5 38 401 411 37 45 Forecasts and Error Analysis Forecast Error Absolute Squared Abs Pct Err 38 0 0 0 0.00% 38 21 2 4 5.00% 38.6 2.4 2.4 5.76 5.85% 39.32 -2.32 2.32 5.3824 6.27% 38.624 6.376 6.376 40.65338 14.17% Total 8.456 13.096 55.79578 31.29% Average 1.6912 2.6192 11.15916 06.26% Before forecast Bias MAD MSE MAPE SE 4.312608 40.5368 9.4632 9.4632 89.55215 18.93% Average after forecast period 6 Bias MAD MSE MAPE Period 6 Period 7 50 44 Forecasting Trend adjusted exponential smoothing Enter alpha and beta (between 0 and 1), enter the past demands in the shaded column then enter a starting forecast. If the starting forecast is not in the first period then delete Alpha Beta Data 0.3 0.7 Demand Period Period 1 Period 2 Period 3 Period 4 Period 5 38 40 41 37 45 Next period Forecasts and Error Analysis Smoothe Forecast d Smoothe Including Forecast, d Trend, Trend, Abs Pct Ft TE FIT Error Absolute Squared Err 38 38 0 0 0 00.00% 38 0 38 2 2 4 05.00% 38.6 0.42 39.02 1.98 1.98 3.9204 04.83% 39.614 0.8358 40.4498 -3.4498 3.4498| 11.90112 09.32% 39.41486 0.111342 39.5262 5.473798 5.4738| 29.96246 0.121641 41.16834 1.26084 42.42918 Total 6.003998 12.9036 49.78398 31.32% Average 1.2008 2.58072| 9.956797 06.26% Bias MAD MSE MAPE SE 4.073655 41.16834 Next period 42.05093 0.617811| 42.66874 Total Average After forecast Bias MAD SE MSE MAPE 0Step by Step Solution
There are 3 Steps involved in it

Get step-by-step solutions from verified subject matter experts