Question: Forecasting Problems I strongly encourage you to attempt these problems by working through the problems on paper and using your calculators for calculations (round to
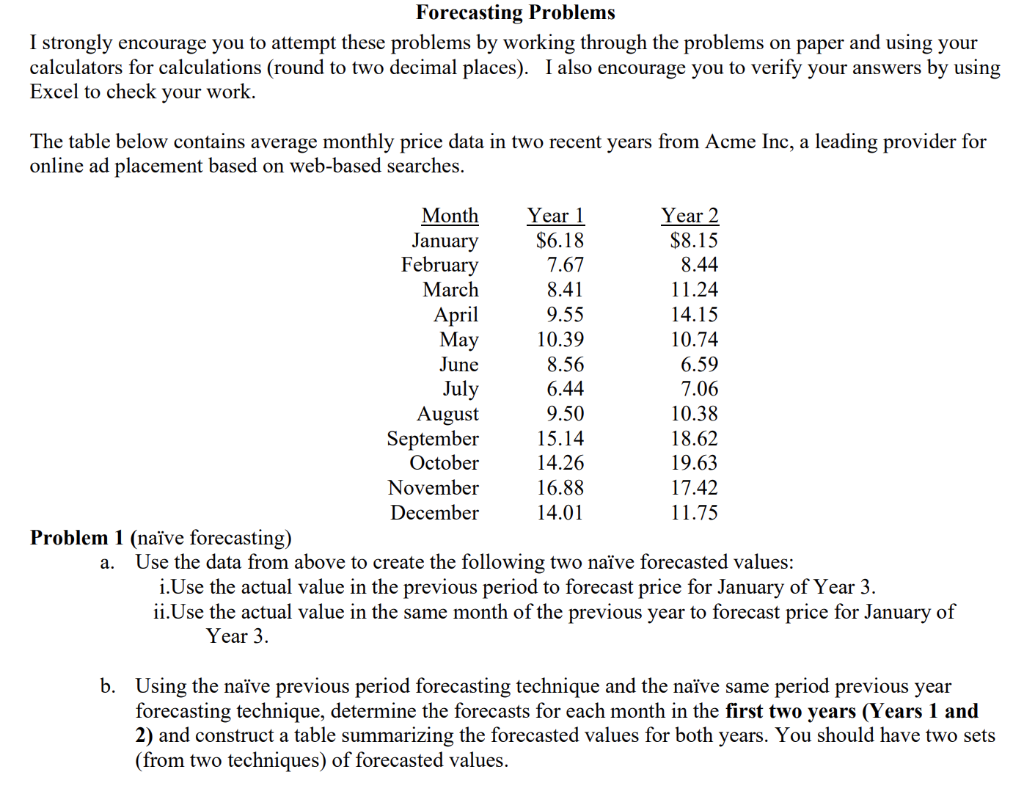
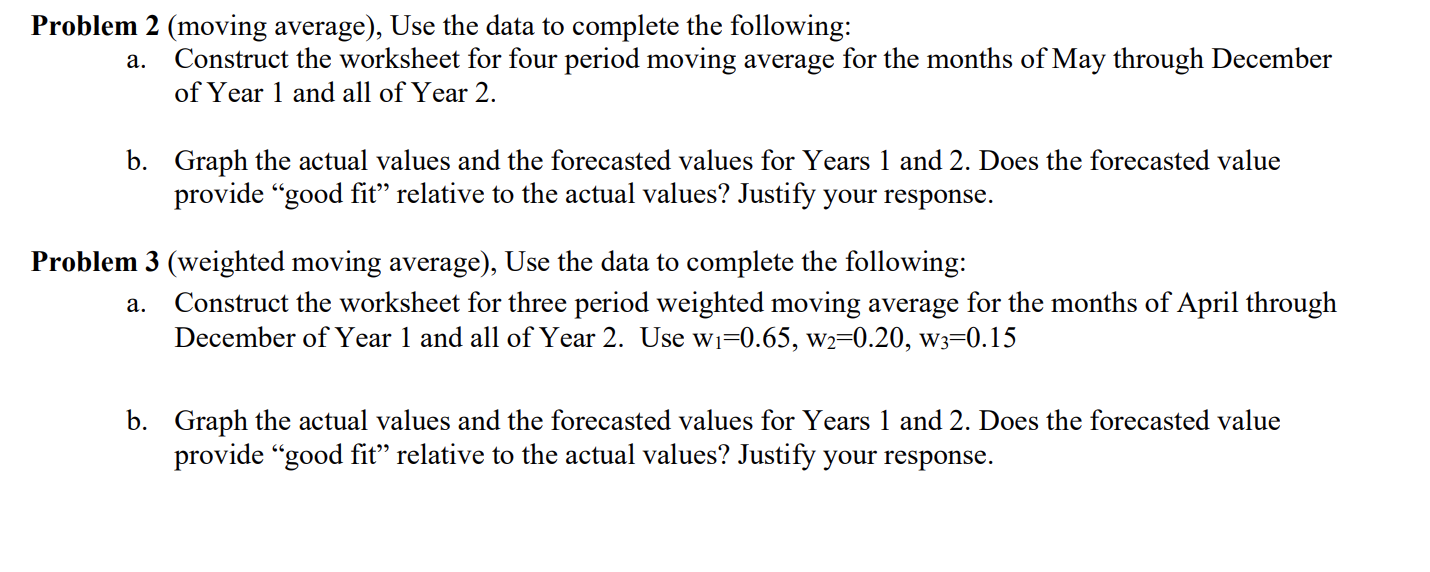
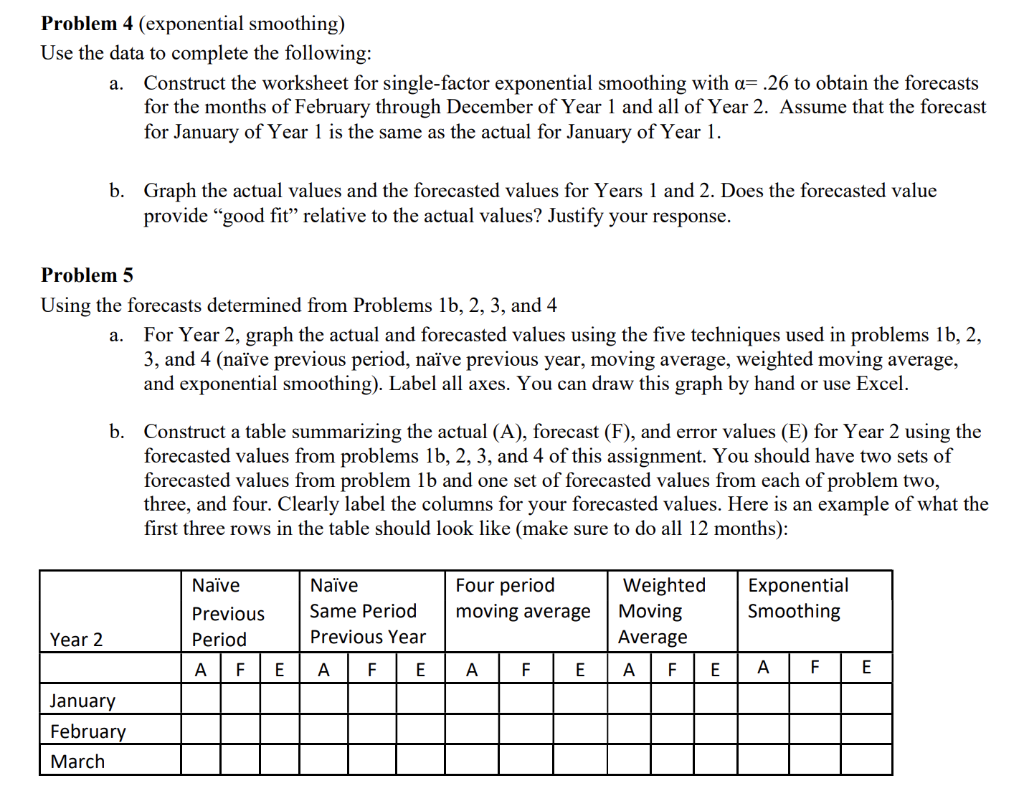
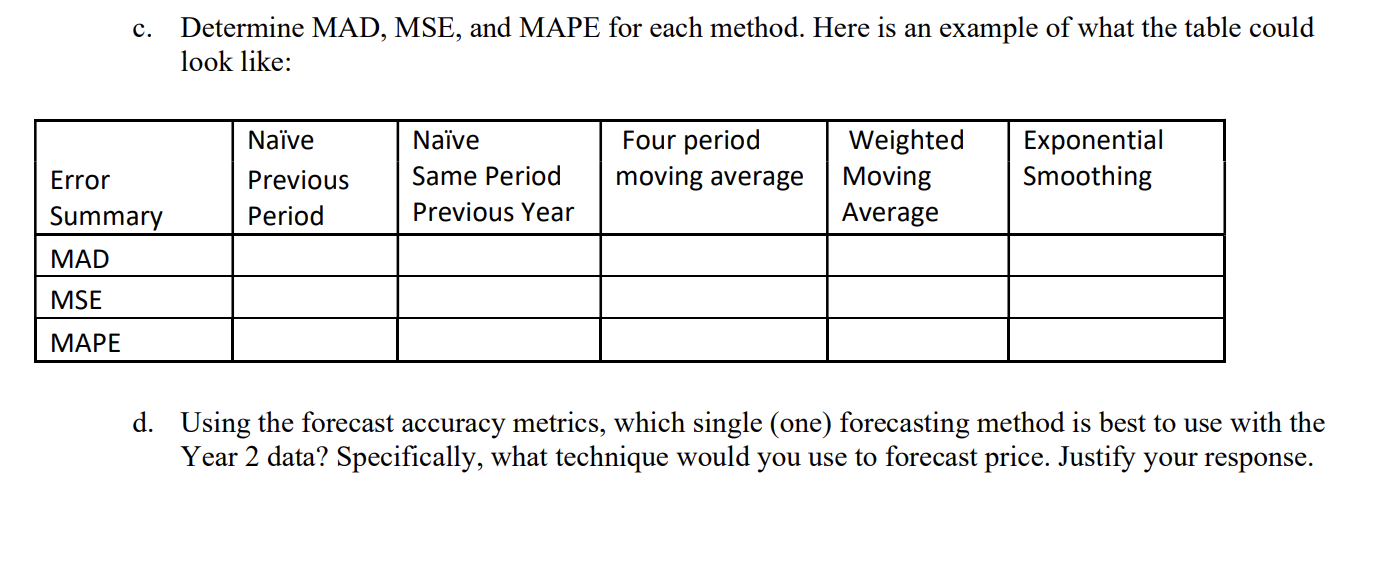
Forecasting Problems I strongly encourage you to attempt these problems by working through the problems on paper and using your calculators for calculations (round to two decimal places). I also encourage you to verify your answers by using Excel to check your work. The table below contains average monthly price data in two recent years from Acme Inc, a leading provider for online ad placement based on web-based searches. Month Year 1 Year 2 January $6.18 $8.15 February 7.67 8.44 March 8.41 11.24 April 9.55 14.15 May 10.39 10.74 June 8.56 6.59 July 6.44 7.06 August 9.50 10.38 September 15.14 18.62 October 14.26 19.63 November 16.88 17.42 December 14.01 11.75 Problem 1 (nave forecasting) a. Use the data from above to create the following two nave forecasted values: i.Use the actual value in the previous period to forecast price for January of Year 3. ii.Use the actual value in the same month of the previous year to forecast price for January of Year 3. b. Using the nave previous period forecasting technique and the nave same period previous year forecasting technique, determine the forecasts for each month in the first two years (Years 1 and 2) and construct a table summarizing the forecasted values for both years. You should have two sets (from two techniques) of forecasted values. Problem 2 (moving average), Use the data to complete the following: Construct the worksheet for four period moving average for the months of May through December of Year 1 and all of Year 2. a. b. Graph the actual values and the forecasted values for Years 1 and 2. Does the forecasted value provide good fit relative to the actual values? Justify your response. Problem 3 (weighted moving average), Use the data to complete the following: Construct the worksheet for three period weighted moving average for the months of April through December of Year 1 and all of Year 2. Use wi=0.65, w2=0.20, w3=0.15 a. b. Graph the actual values and the forecasted values for Years 1 and 2. Does the forecasted value provide good fit relative to the actual values? Justify your response. Problem 4 (exponential smoothing) Use the data to complete the following: Construct the worksheet for single-factor exponential smoothing with a= .26 to obtain the forecasts for the months of February through December of Year 1 and all of Year 2. Assume that the forecast for January of Year 1 is the same as the actual for January of Year 1. a. b. Graph the actual values and the forecasted values for Years 1 and 2. Does the forecasted value provide good fit relative to the actual values? Justify your response. Problem 5 Using the forecasts determined from Problems 1b, 2, 3, and 4 For Year 2, graph the actual and forecasted values using the five techniques used in problems 1b, 2, 3, and 4 (nave previous period, nave previous year, moving average, weighted moving average, and exponential smoothing). Label all axes. You can draw this graph by hand or use Excel. a. b. Construct a table summarizing the actual (A), forecast (F), and error values (E) for Year 2 using the forecasted values from problems 1b, 2, 3, and 4 of this assignment. You should have two sets of forecasted values from problem lb and one set of forecasted values from each of problem two, three, and four. Clearly label the columns for your forecasted values. Here is an example of what the first three rows in the table should look like (make sure to do all 12 months): Nave Previous Period Nave Same Period Previous Year Four period moving average Exponential Smoothing Weighted Moving Average A F E Year 2 . F E A F E A F E A F E January February March c. Determine MAD, MSE, and MAPE for each method. Here is an example of what the table could look like: Nave Four period moving average Nave Same Period Previous Year Error Summary Exponential Smoothing Previous Period Weighted Moving Average MAD MSE MAPE d. Using the forecast accuracy metrics, which single (one) forecasting method is best to use with the Year 2 data? Specifically, what technique would you use to forecast price. Justify your response


