

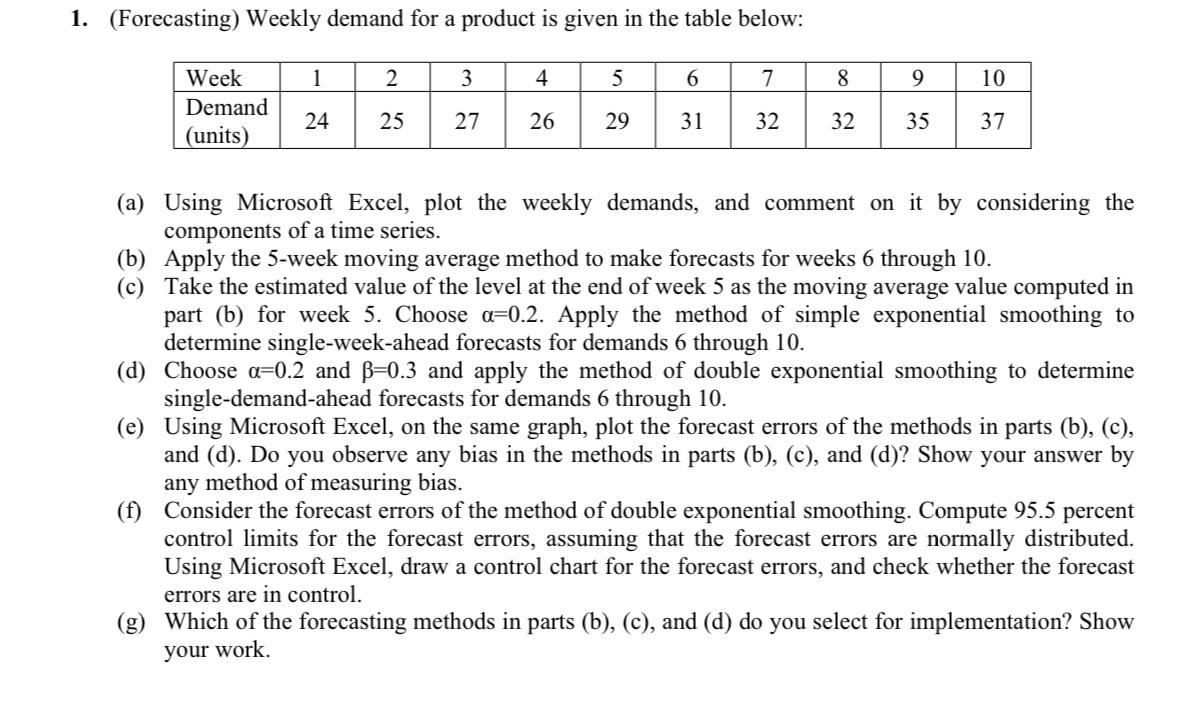
Question: ( Forecasting ) Weekly demand for a product is given in the table below: table [ [ Week , 1 , 2 , 3
Forecasting Weekly demand for a product is given in the table below:
tableWeektableDemandunits
a Using Microsoft Excel, plot the weekly demands, and comment on it by considering the components of a time series.
b Apply the week moving average method to make forecasts for weeks through
c Take the estimated value of the level at the end of week as the moving average value computed in part b for week Choose Apply the method of simple exponential smoothing to determine singleweekahead forecasts for demands through
d Choose and and apply the method of double exponential smoothing to determine singledemandahead forecasts for demands through
e Using Microsoft Excel, on the same graph, plot the forecast errors of the methods in parts bc and d Do you observe any bias in the methods in parts bc and d Show your answer by any method of measuring bias.
f Consider the forecast errors of the method of double exponential smoothing. Compute percent control limits for the forecast errors, assuming that the forecast errors are normally distributed. Using Microsoft Excel, draw a control chart for the forecast errors, and check whether the forecast errors are in control.
g Which of the forecasting methods in parts bc and d do you select for implementation? Show your work.
Step by Step Solution
There are 3 Steps involved in it
1 Expert Approved Answer
Step: 1 Unlock

Question Has Been Solved by an Expert!
Get step-by-step solutions from verified subject matter experts
Step: 2 Unlock
Step: 3 Unlock