

Question: 1 . ( Forecasting ) Weekly demand for a product is given in the table below: ( a ) Using Microsoft Excel, plot the weekly
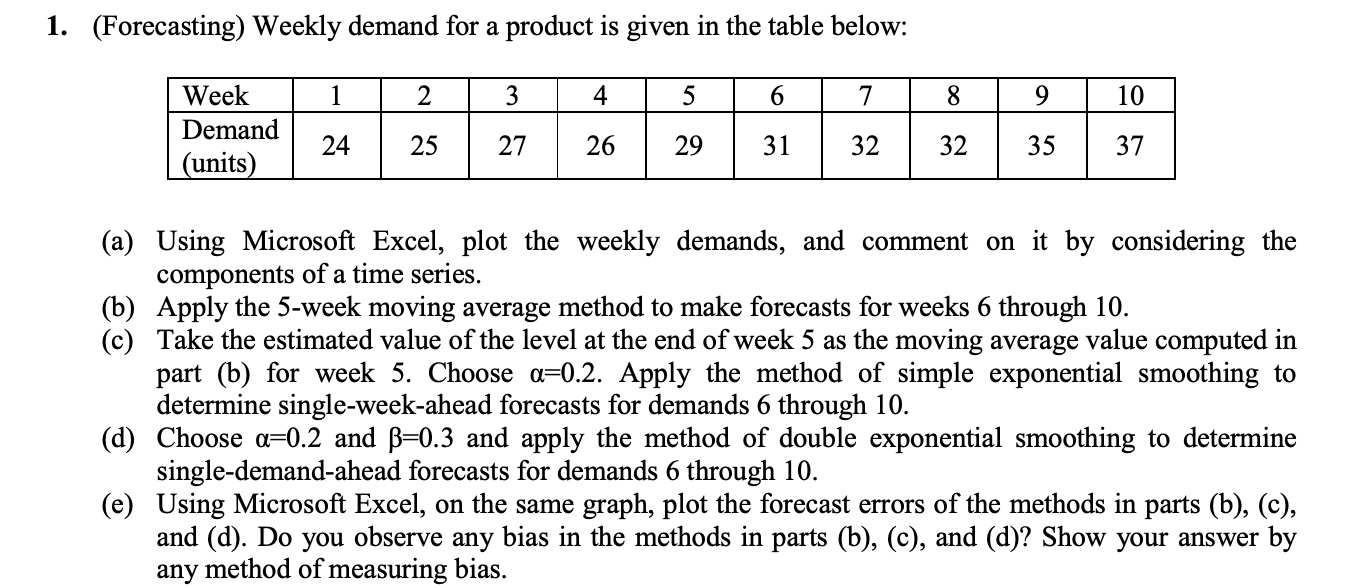
Forecasting Weekly demand for a product is given in the table below:
a Using Microsoft Excel, plot the weekly demands, and comment on it by considering the components of a time series.
b Apply the week moving average method to make forecasts for weeks through
c Take the estimated value of the level at the end of week as the moving average value computed in part b for week Choose alpha Apply the method of simple exponential smoothing to determine singleweekahead forecasts for demands through
d Choose alpha and beta and apply the method of double exponential smoothing to determine singledemandahead forecasts for demands through
e Using Microsoft Excel, on the same graph, plot the forecast errors of the methods in parts bc and d Do you observe any bias in the methods in parts bc and d Show your answer by any method of measuring bias.
Step by Step Solution
There are 3 Steps involved in it
1 Expert Approved Answer
Step: 1 Unlock

Question Has Been Solved by an Expert!
Get step-by-step solutions from verified subject matter experts
Step: 2 Unlock
Step: 3 Unlock