

Question: Forecasts tab: use the data in columns A - B and apply the 4 forecasting models below in columns C - F ( yellow cells
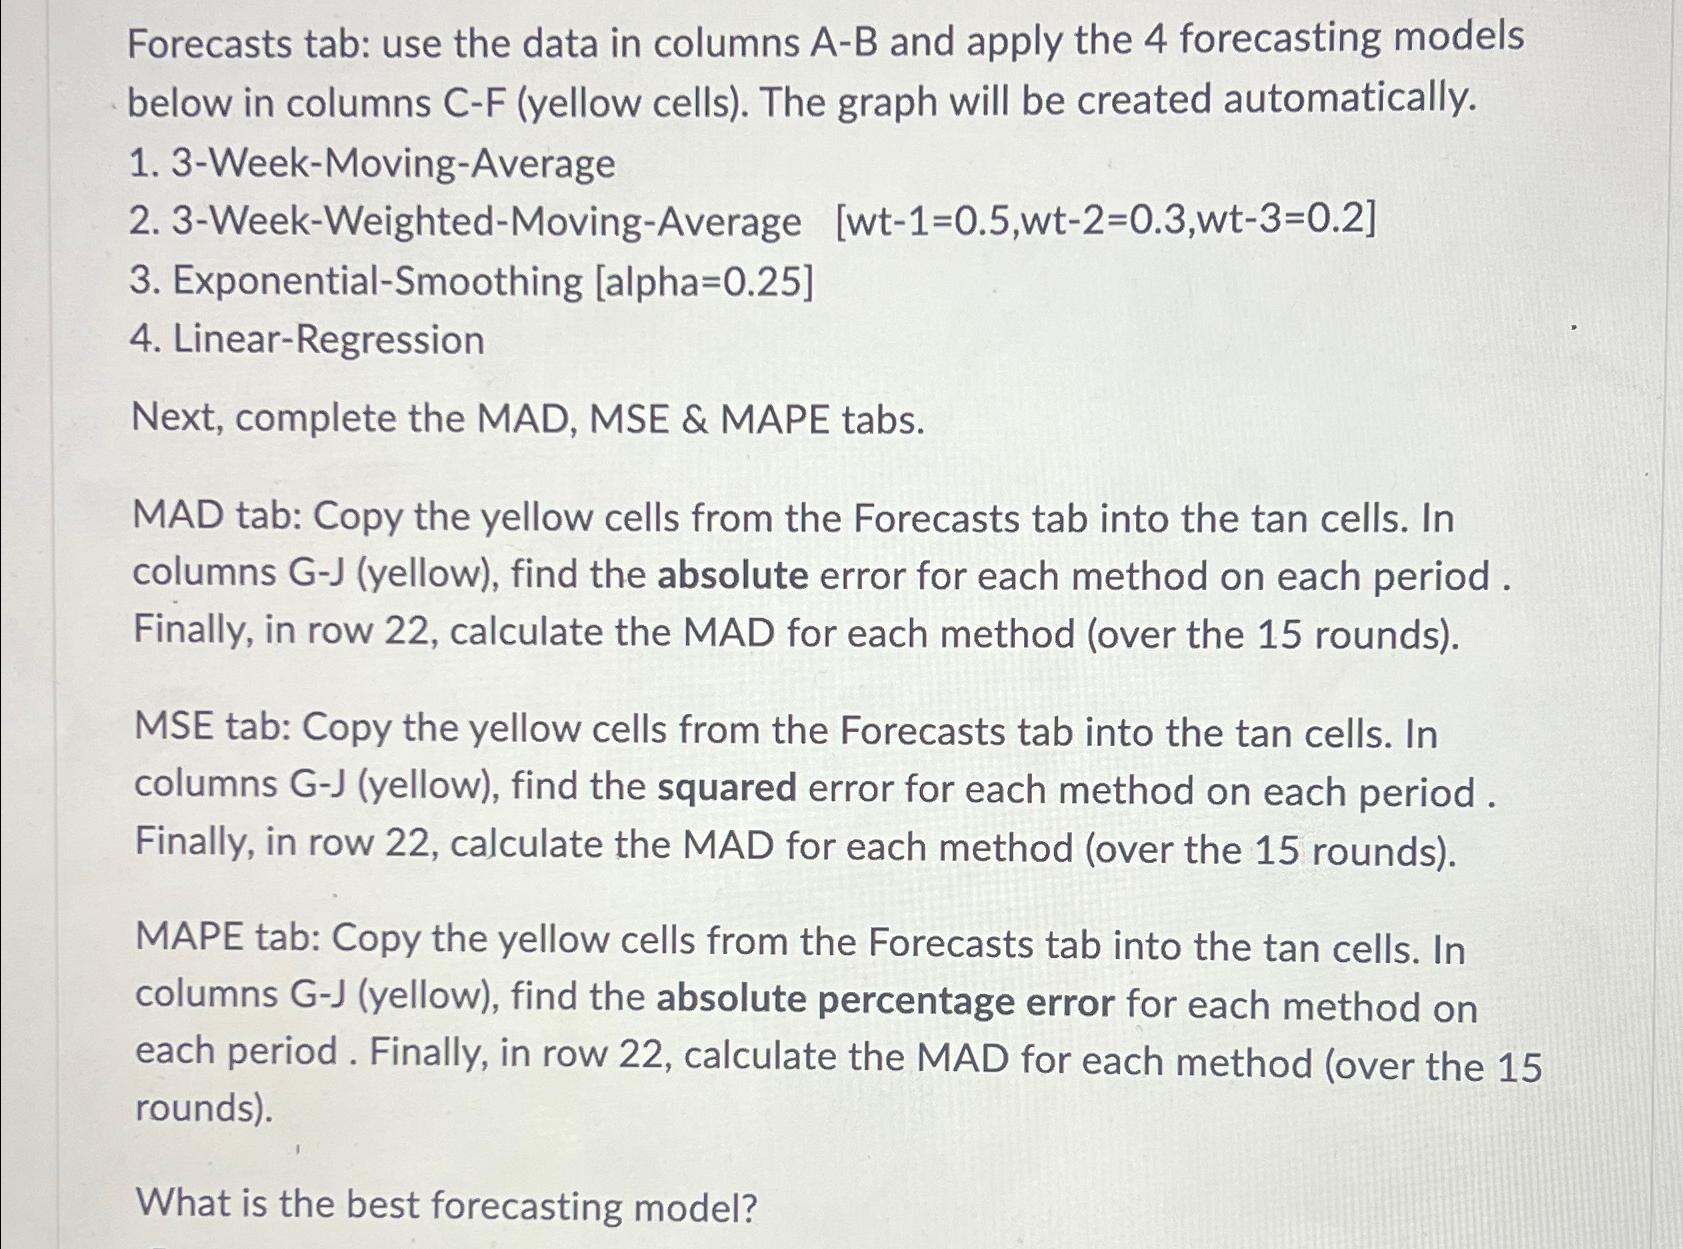
Forecasts tab: use the data in columns AB and apply the forecasting models below in columns yellow cells The graph will be created automatically.
WeekMovingAverage
WeekWeightedMovingAverage wtwtwt
ExponentialSmoothing alpha
LinearRegression
Next, complete the MAD, MSE & MAPE tabs
MAD tab: Copy the yellow cells from the Forecasts tab into the tan cells. In columns GJ yellow find the absolute error for each method on each period Finally, in row calculate the MAD for each method over the rounds
MSE tab: Copy the yellow cells from the Forecasts tab into the tan cells. In columns GJ yellow find the squared error for each method on each period Finally, in row calculate the MAD for each method over the rounds
MAPE tab: Copy the yellow cells from the Forecasts tab into the tan cells. In columns GJ yellow find the absolute percentage error for each method on each period. Finally, in row calculate the MAD for each method over the rounds
What is the best forecasting model?
Step by Step Solution
There are 3 Steps involved in it
1 Expert Approved Answer
Step: 1 Unlock

Question Has Been Solved by an Expert!
Get step-by-step solutions from verified subject matter experts
Step: 2 Unlock
Step: 3 Unlock