

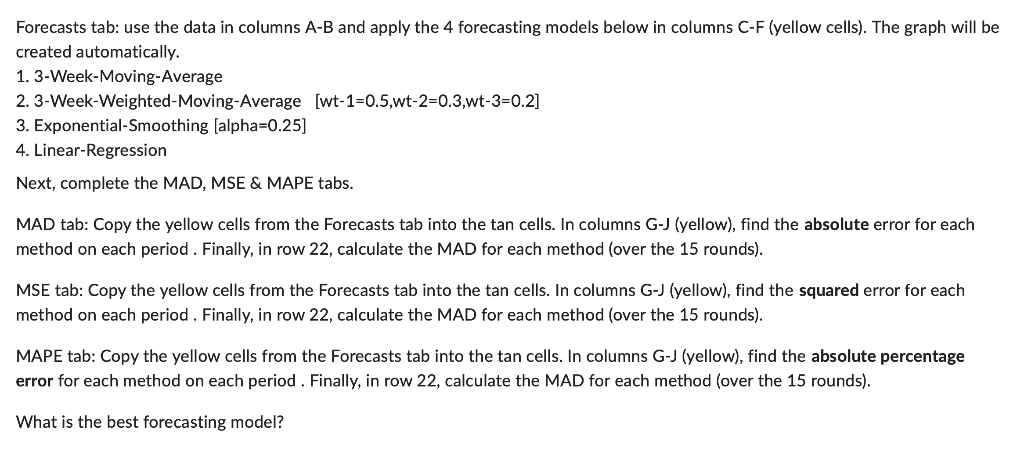
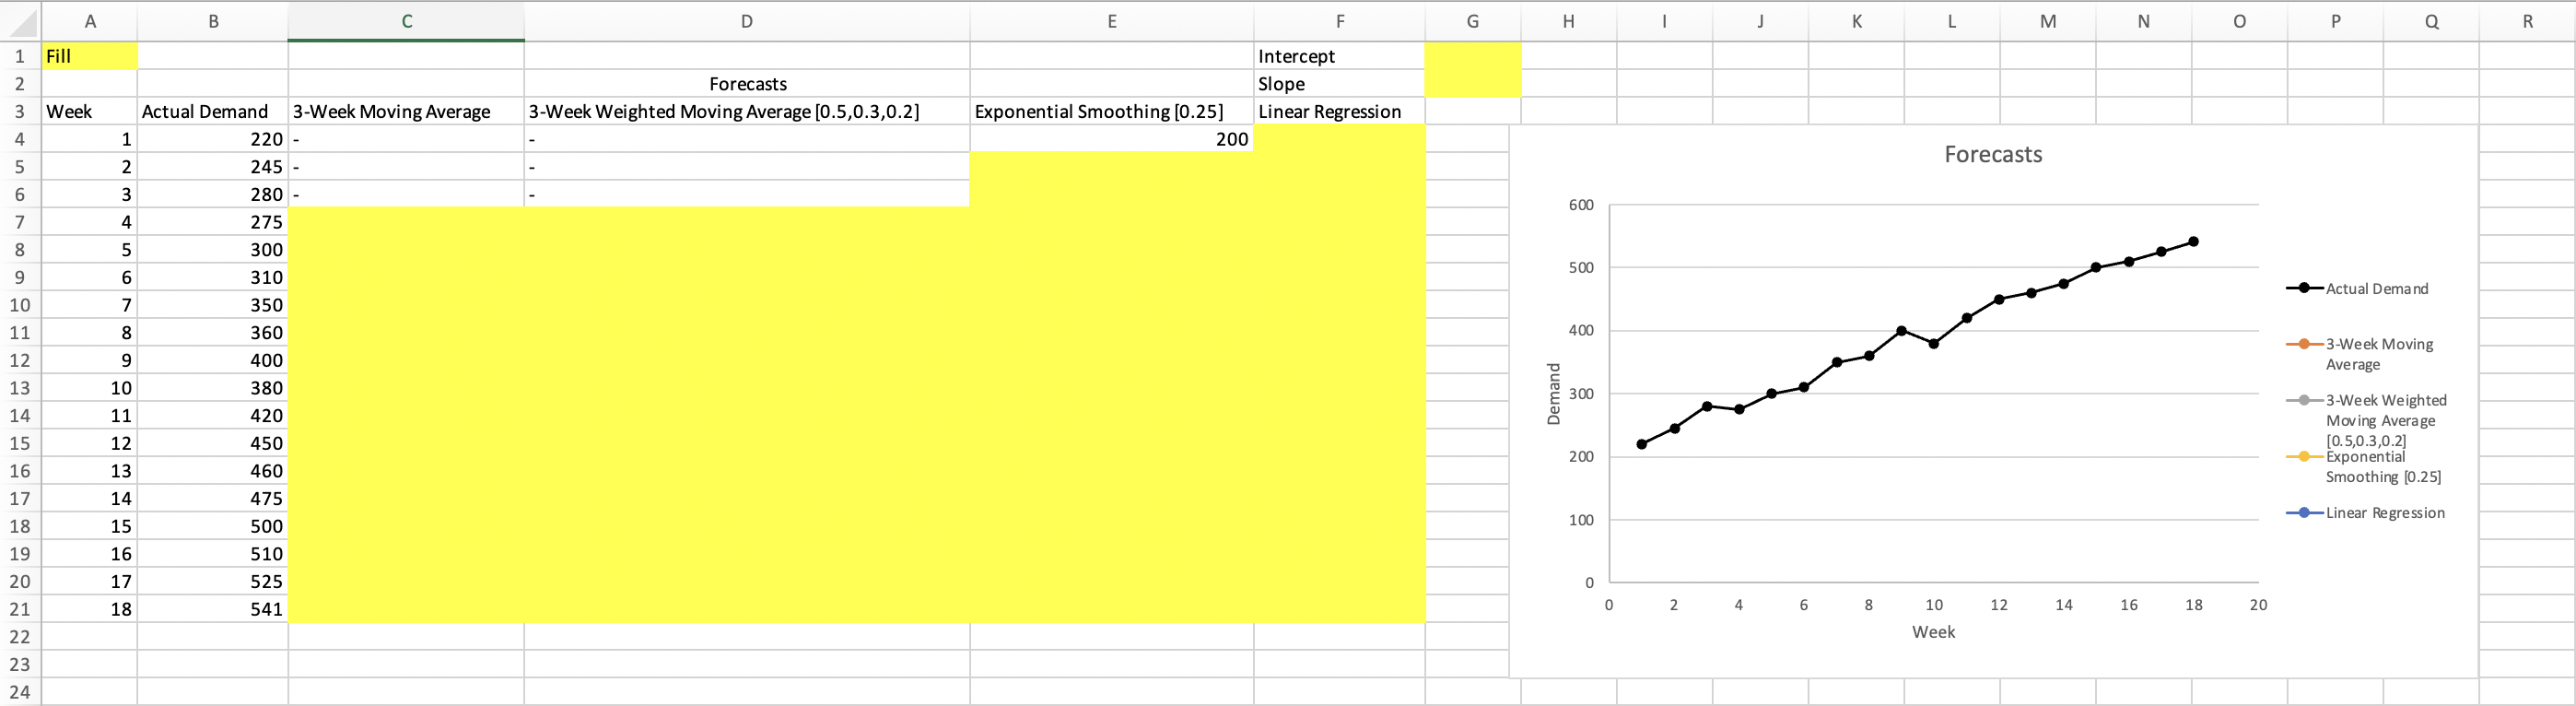
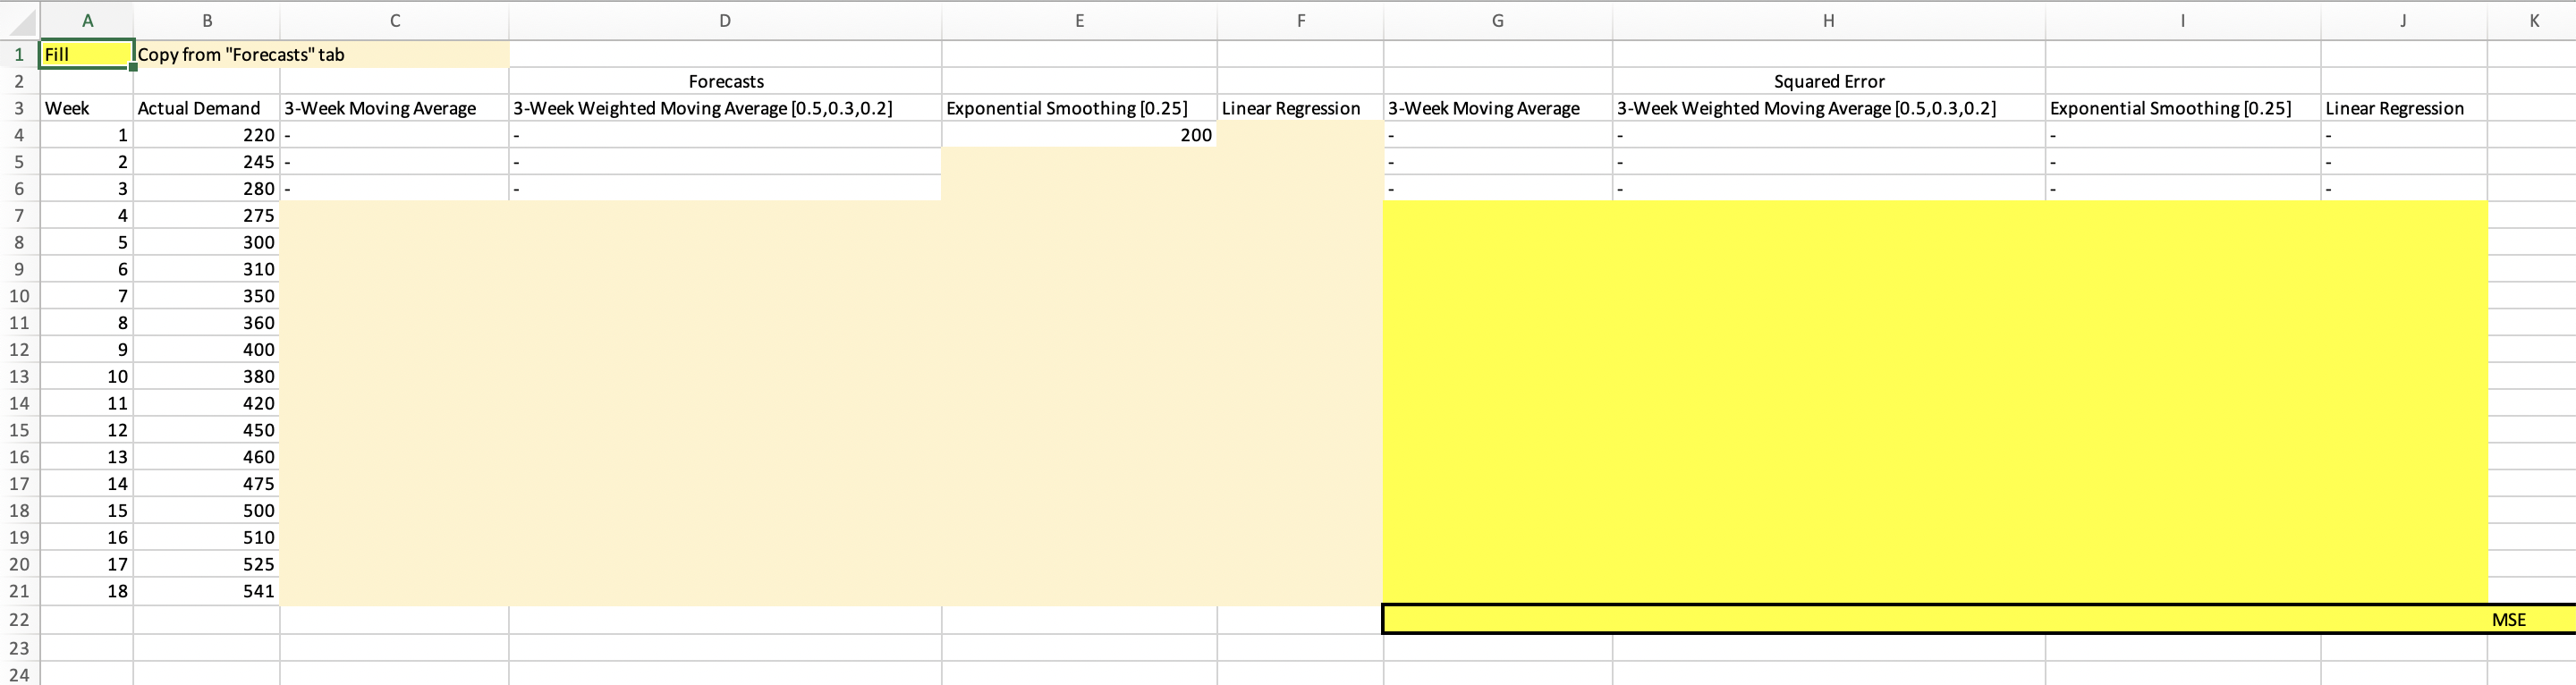
Question: Forecasts tab: use the data in columns A-B and apply the 4 forecasting models below in columns CF (yellow cells). The graph will be created

Step by Step Solution
There are 3 Steps involved in it
1 Expert Approved Answer
Step: 1 Unlock

Question Has Been Solved by an Expert!
Get step-by-step solutions from verified subject matter experts
Step: 2 Unlock
Step: 3 Unlock