

Question: Formatting as Table Styles Filter 22 X V fx A B C D E F G H I J K L M Mass Added to
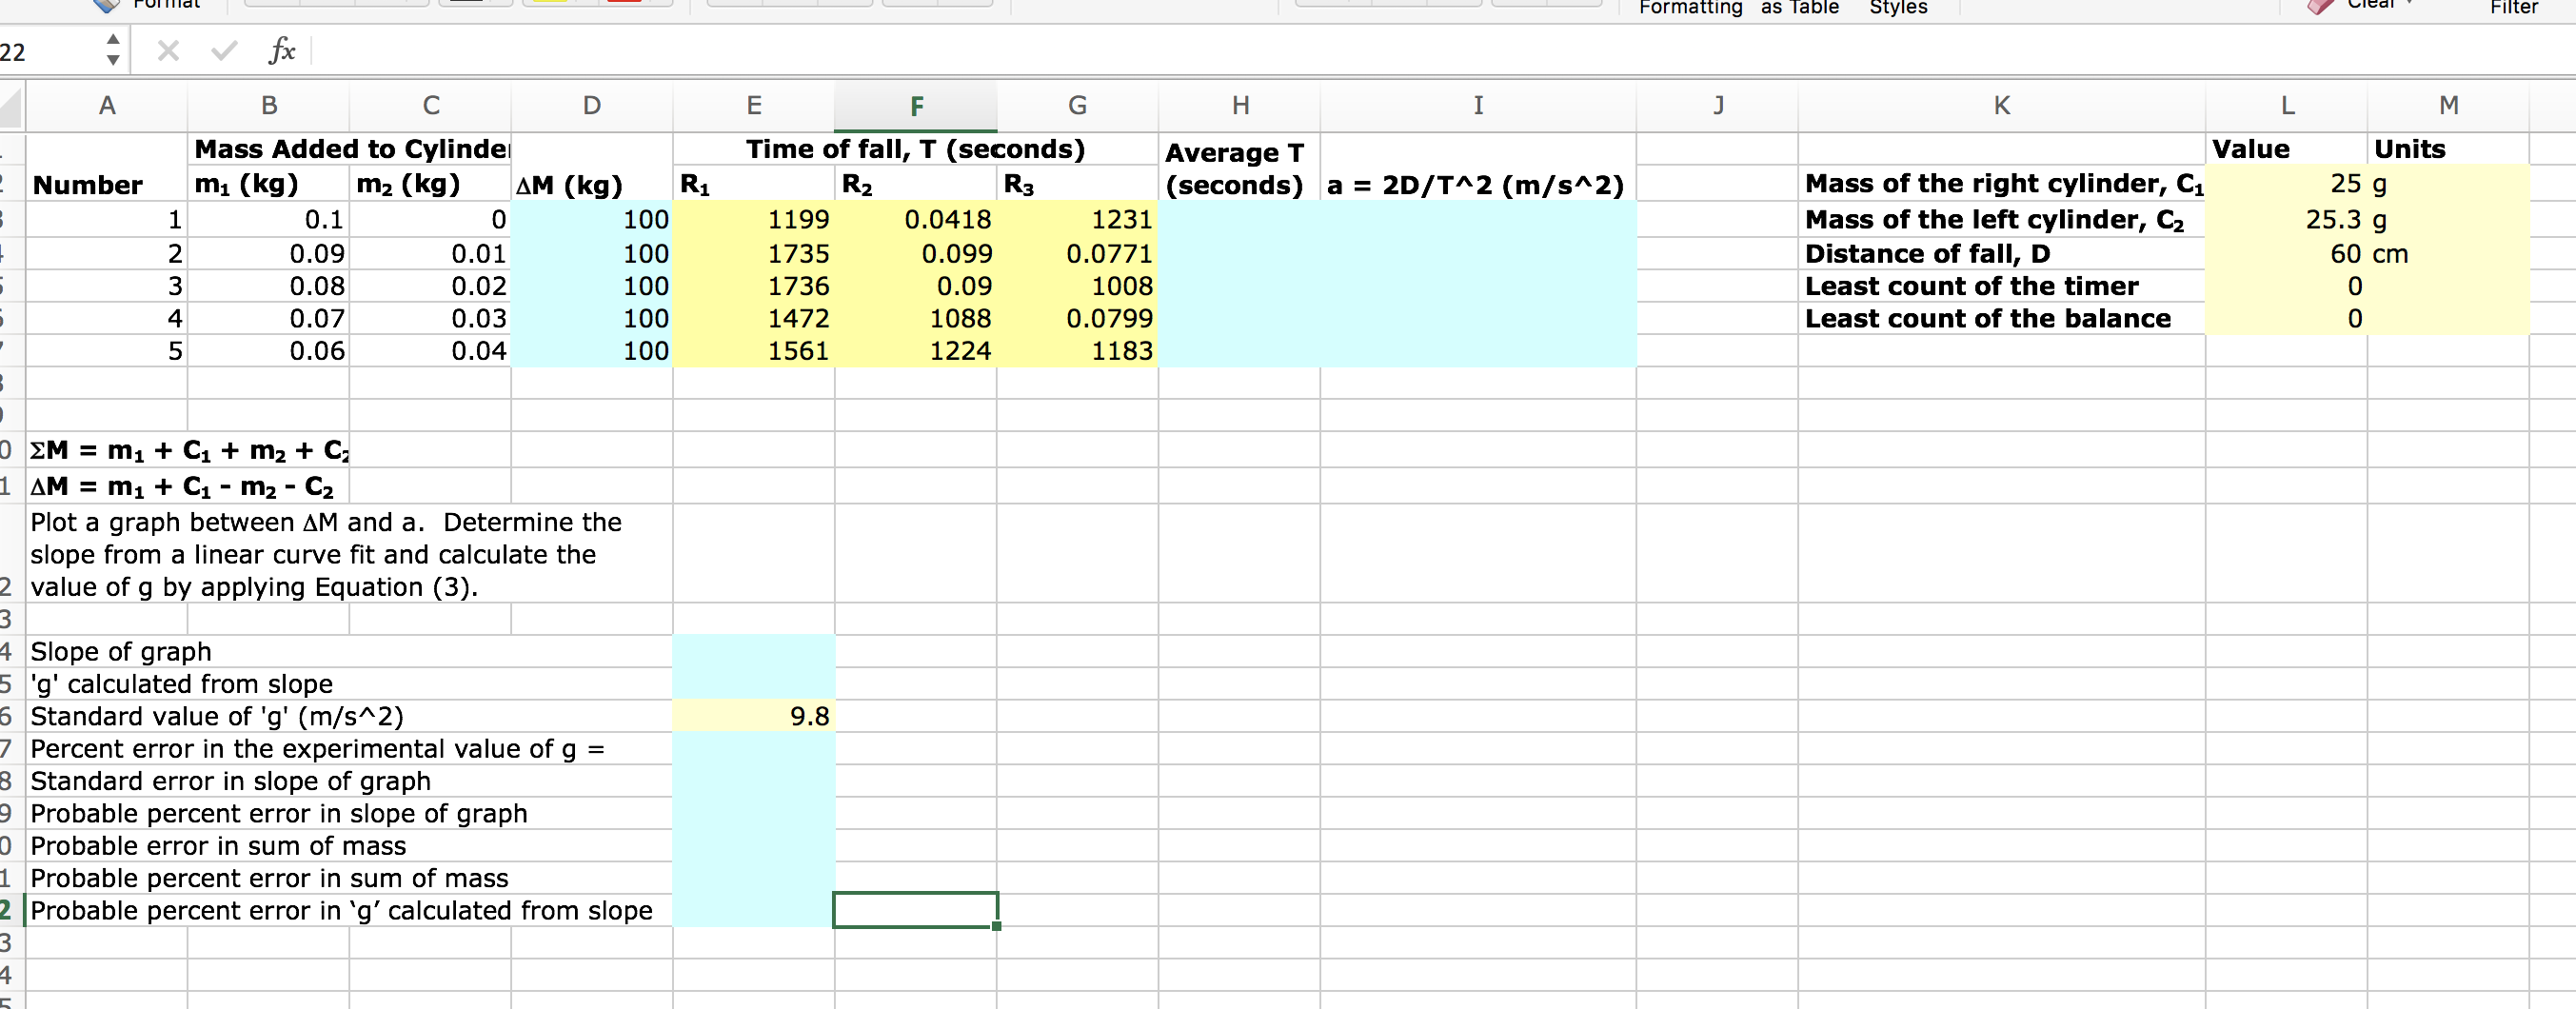
Formatting as Table Styles Filter 22 X V fx A B C D E F G H I J K L M Mass Added to Cylinder Time of fall, T (seconds) Average T Value Units Number m1 (kg) m2 (kg) AM (kg) R1 R2 R3 (seconds) a = 2D/T^2 (m/s^2) Mass of the right cylinder, C1 25 g 0.1 0 100 1199 0.0418 1231 Mass of the left cylinder, C2 25.3 g 0.09 0.01 100 1735 0.099 0.0771 Distance of fall, D 60 cm UTAWNY 0.08 0.02 100 1736 0.09 1008 Least count of the timer 0.07 0.03 100 1472 1088 0.0799 Least count of the balance O 0.06 0.04 100 1561 1224 1183 EM = m1 + C1 + m2 + C AM = m1 + C1 - m2 - C2 Plot a graph between AM and a. Determine the slope from a linear curve fit and calculate the value of g by applying Equation (3). Slope of graph g' calculated from slope Standard value of 'g' (m/s^2) 9.8 Percent error in the experimental value of g = Standard error in slope of graph Probable percent error in slope of graph Probable error in sum of mass Probable percent error in sum of mass Probable percent error in 'g' calculated from slope
Step by Step Solution
There are 3 Steps involved in it

Get step-by-step solutions from verified subject matter experts