

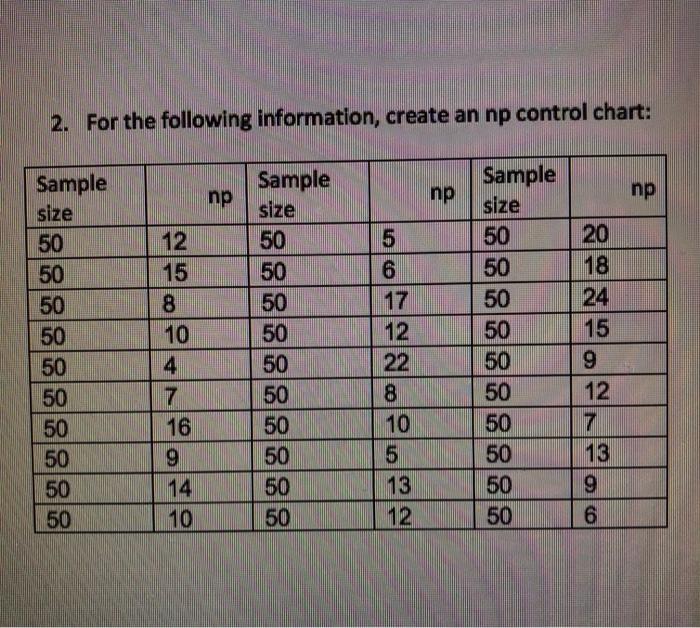
Question: Formulars question Attribute Data Chart Formulas Chart Type Subgroup Size Control Limits p Chart Fraction Defective Variable or Constant Central Line: D-p/ UCL = p+3V
Formulars 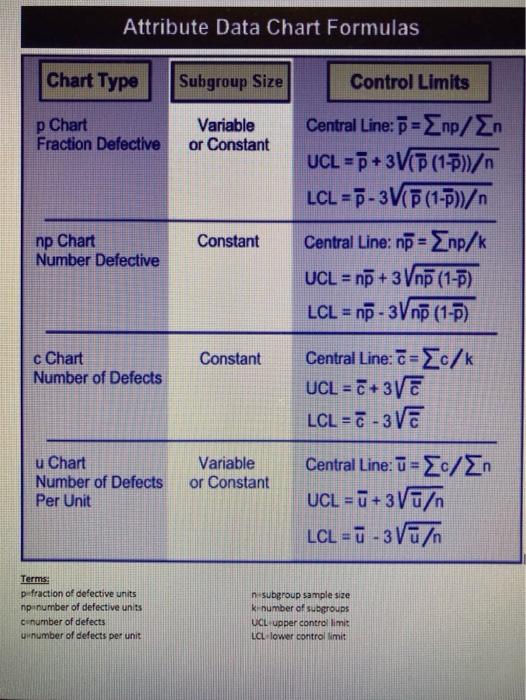
question
Step by Step Solution
There are 3 Steps involved in it
1 Expert Approved Answer
Step: 1 Unlock

Question Has Been Solved by an Expert!
Get step-by-step solutions from verified subject matter experts
Step: 2 Unlock
Step: 3 Unlock