

Question: please separate ech question answer (formulars) 1. 2. 3. 4. Attribute Data Chart Formulas Chart Type Subgroup Size Control Limits p Chart Fraction Defective Variable
please separate ech question answer
(formulars) 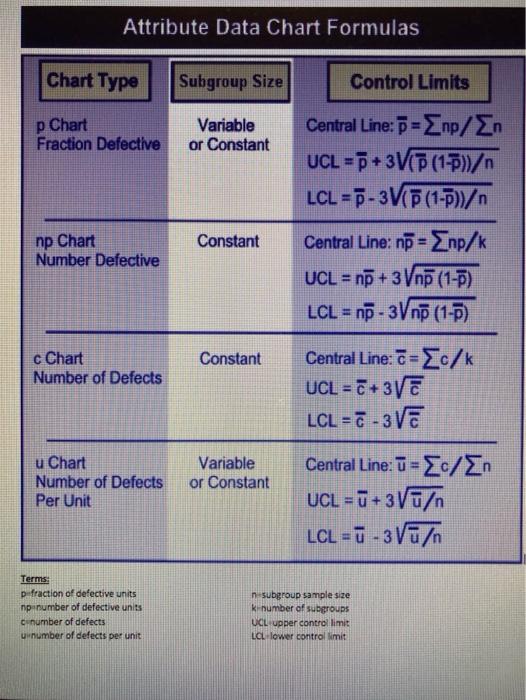
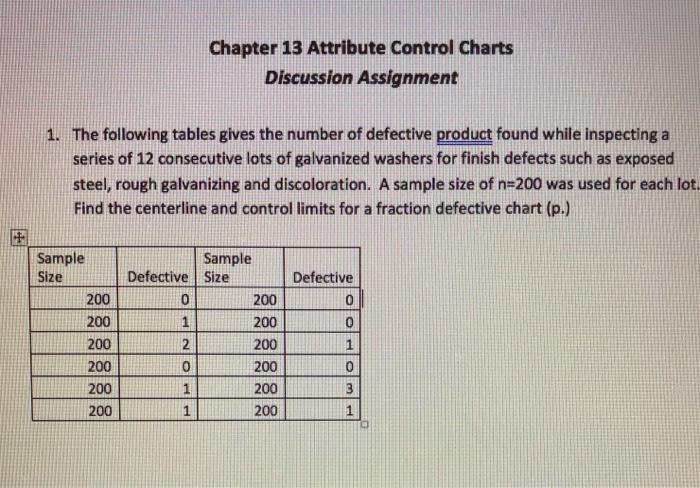
1.
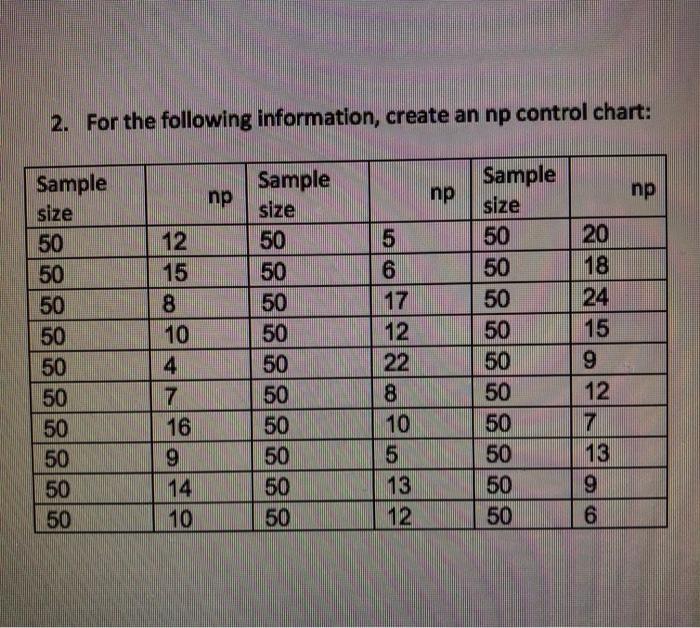
2.
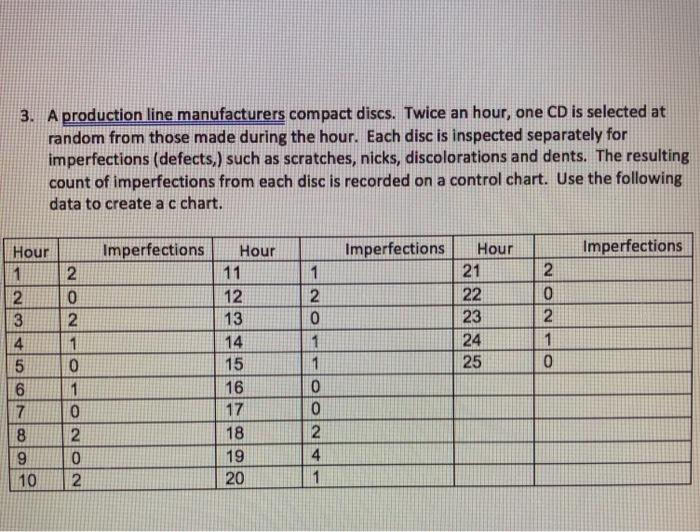
3.
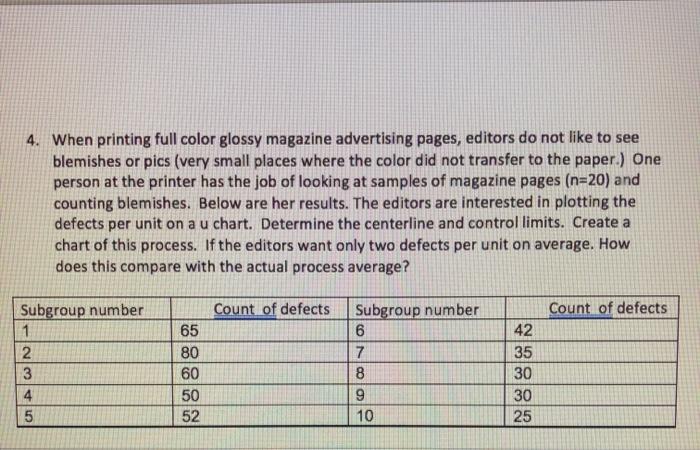
4.
Step by Step Solution
There are 3 Steps involved in it
1 Expert Approved Answer
Step: 1 Unlock

Question Has Been Solved by an Expert!
Get step-by-step solutions from verified subject matter experts
Step: 2 Unlock
Step: 3 Unlock